Fox Valley Real Estate Market Update Week 36

Fox Valley Real Estate Market Update Week 36-Cover

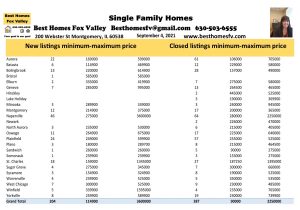
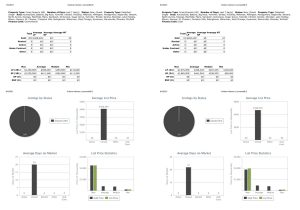
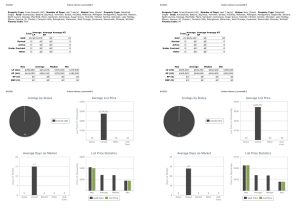
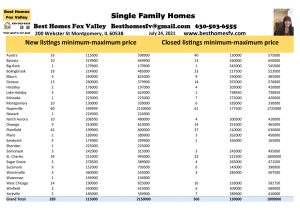
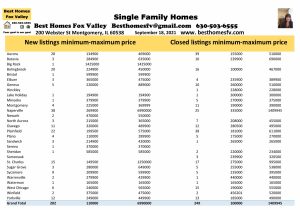
Fox Valley real estate market update week 36.  New listings of single family homes were up.  239 this week compared to 204 the week before.  Inventory o f homes continues to be a challenge.  Now that school is back in session there was a slow down.  Hopefully now things will get back to normal and more listings will come on the market.

Closed listings of single family homes were also down.  205 this week compared to 387 the week before.  This is to be expected at the beginning of the month.  It will increase as we head into the end of the month when most buyers want to close.

Fox Valley Real Estate Market Update Week 36

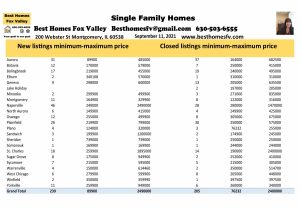
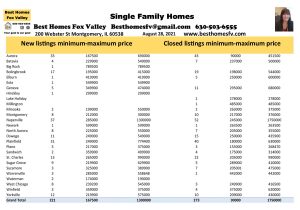
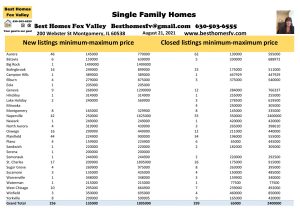
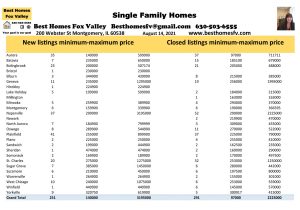
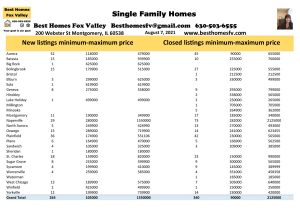
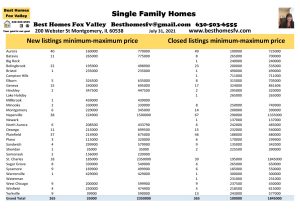
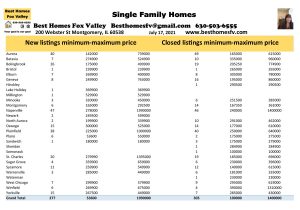
Take a look at the communities with the most activity this week:

Aurora-New 31 $89,900-$485,000

             Closed-37 $164,000-$682,500

Batavia-New 12 $170,000-$579,000

             Closed-7 $250,000-$415,000

Bolingbrook-New 17 $219,000-$455,000

                    Closed-19 $240,000-$495,000

Geneva-New 9 $298,000-$600,000

             Closed-13 $205,000-$635,500

Montgomery-New 11 $164,900-$329,900

                     Closed-8 $122,000-$316,000

Naperville-New 46 $249,000-$2,490,000

                  Closed-28 $280,000-$1,470,000

Oswego-New 12 $255,000-$499,900

              Closed-8 $305,000-$675,000

Plainfield-New 26 $219,900-$799,000

                 Closed-30 $250,000-$575,000

St Charles-New 18 $259,900-$1,895,000

                  Closed-14 $190,000-$2,400,000

Yorkville-New 11 $259,900-$949,000

                Closed-6 $260,000-$340,000

You can see the other communities by clicking on the picture above.

Financing, median price and 2,000 or more square feet

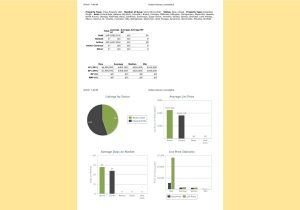
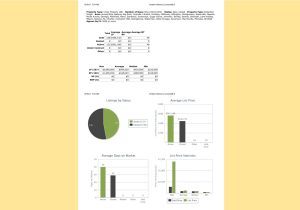
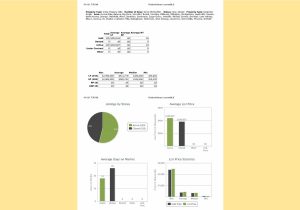
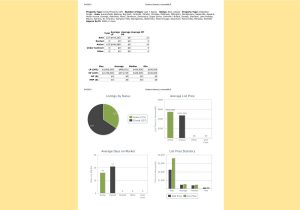
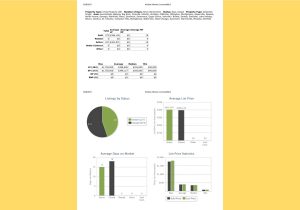
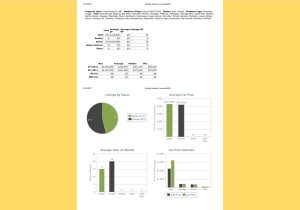
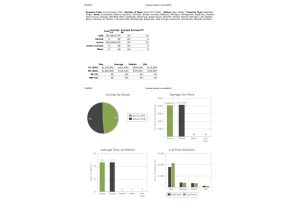
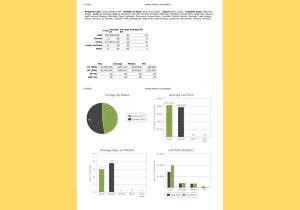
Median list price this week $350,000, last week also $350,000.  Closed median price this week $340,000, last week $345,000.  This is the second week with a decrease.

Fox Valley Real Estate Market Update Week 36-Stats 091121
Median list and closed price this week


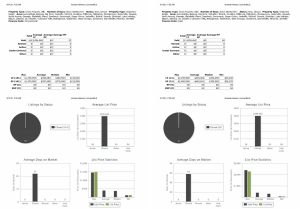
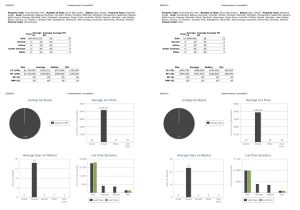
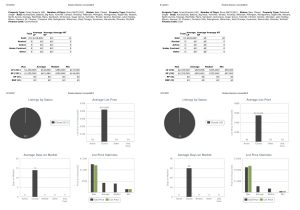
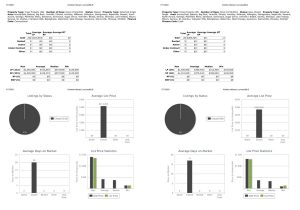
Out of 205 closed single family homes 161 of them used Conventional financing.  21 of them were Cash.

Fox Valley Real Estate Market Update Week 36-Conventional and Cash 091121
Conventional and Cash

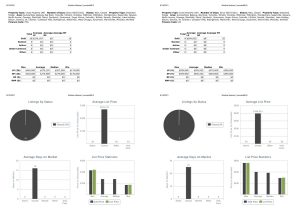
20 of the closed single family homes chose FHA financing, and 3 chose VA financing.

Fox Valley Real Estate Market Update Week 36-FHA and VA 091121
FHA and VA financing

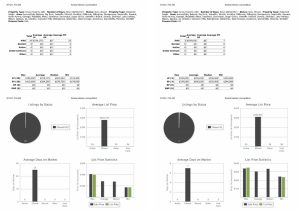
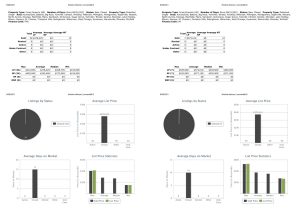
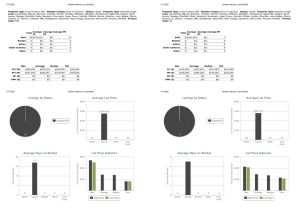
127 of them were 2,000 square feet or more this week with a median closed price of $410,000.  Minimum closed price was $191,000.  So if you are looking for a home with this square feet or more, this is the price range for this week.

Fox Valley Real Estate Market Update Week 36-2000 or more sf 091121
2,000 or more square feet

Contracts accepted this week

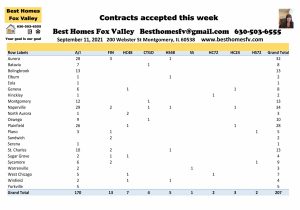
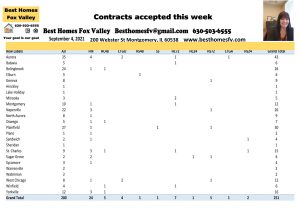
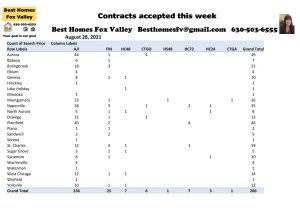
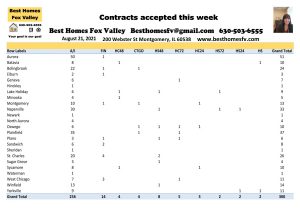
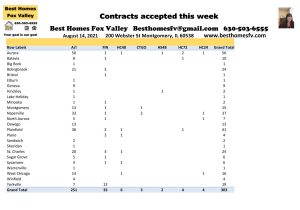
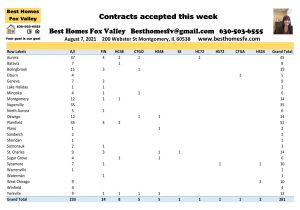
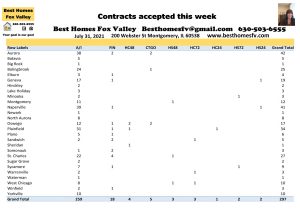
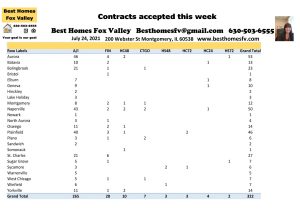
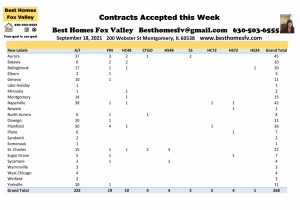
Contracts accepted this week on single family homes was down.  207 this week compared to 251 the week before.  buyers are still out there looking but they are having a hard time finding what they are looking for with the inventory so low.

Fox Valley Real Estate Market Update Week 36-Contracts accepted this week

Look at the communities that seller’s accepted the most contracts this week:

Aurora-32                                  Bolingbrook-13

Montgomery-13                          Naperville-34

Oswego-10                                 Plainfield-28

St Charles-13

There was 1 short sales accepted this week and it was in Warrenville.  Now it will be submitted to the lender to see if they will also accept.

Seller’s accepted contracts that are contingent on the buyer closing on their current home.  2 with a kick-out clause of 72 hours, 7 with 48 hours, and 3 with 24 hours.

Also, seller’s accepted contracts that are contingent on the buyer selling and closing on their current home.  2 with a kick-out clause of 72 hours and 5 with 48 hours.

2021 by the month

Month        New     Closed     Contracts accepted

January          543            649                    829

February        561             604                   778

March            993            1099                 1455

April             1006             926                 1387

May              1088            1288                 1289

June             1450            1686                 1671

July              1118             1182                  1210

August          1109            1203                  1170

September    443              592                   458

Totals          8311            9229                10247

 June was the best month so far for closings.  Buyer’s could get moved in and enjoy the summer in their new home.  Now would be a good time to get moved in before winter and the holidays.  Homes continue to sell all year.

Check back with us every Saturday.  At the end of the month we compare this year to 2020 and 2019 so you can see how things are going.

Contact us

Call us at 630-503-6555 with all your real estate questions.  Your goal is our goal.  We will do everything we can to help  you reach your goal.

Request a home valuation if you are thinking about selling your home.  Tell us a little bit about your home and what has been recently updated.  We will provide you with a net proceeds that shows you the expenses to sell.  This will be updated when an offer comes in and we know all the terms so you can make a good decision.

Are you thinking about buying a home?  The first thing you need to do is get all your financial information together and contact a loan officer.  You will need to email or drop off copies of all your financial documents so they can put you through underwriting to get pre approved.  Just calling them and telling them your information is not good enough anymore.  You need to get pre approved so when you find a home you are ready to submit an offer.

When you start the process of looking at homes, you need to be ready to go look when a home hits the market.  If you wait for the weekend it might be gone already.

Resources:

If you need recommendations for loan officer’s, real estate attorney’s, and home inspector’s we would be happy to provide you with a few of each to contact.  You can decide who you want to work with.

All data used is from our MLS MRED, LLC.

As we look back on 20 years since 9/11/01, take a moment to reflect on all the lives lost that day.  We will never forget!

Fox Valley real estate market update week 36.  Have a great week!

Fox Valley real estate market update week 36-Kristine Heiman Managing BrokerKristine Heiman, SFR, SRS, AHWD

Designated Managing Broker

Best Homes Fox Valley-Search for a home today!

200 Webster St

Montgomery, IL 60538

630-503-6555 ext 101


Fox Valley Real Estate Market Update week 35

Fox Valley Real Estate Market Update Week 35-Cover

Fox Valley real estate market update week 35.  New listings of single family homes are down.  204 this week compared to 221 the week before.  We are not going in the right direction.  Things usually slow down when school starts, but then it starts back up again.

Closed listings of single family homes are up.  387 this week compared to 273 the week before.  Most of these were probably closed on Monday and Tuesday the last 2 days of the month of August.  Most buyers like to close at the end of the month so they can bring less to closings.

Fox Valley Market Update Week 35

Take a look at the communities with the most activity this week:

Aurora-New 22 $169,000-$599,000

             Closed-61 $106,000-$705,000

Batavia-New 6 $114,900-$469,900

             Closed-12 $229,000-$580,000

Bolingbrook-New 13 $220,000-$614,900

                    Closed-28 $157,000-$490,000

Geneva-New 7 $285,000-$995,000

             Closed-13 $264,500-$465,000

Montgomery-New 12 $214,900-$375,000

                     Closed-17 $200,000-$365,000

Naperville-New 46 $275,000-$3,600,000

                  Clsoed-64 $280,000-$2,250,000

Oswego-New 11 $264,900-$675,000

              Closed-17 $225,000-$640,000

Plainfield-New 24 $249,000-$599,900

                Closed-57 $255,000-$525,000

St Charles-New 18 $159,000-$1,345,000

                   Closed-27 $187,250-$1,395,000

Yorkville-New 8 $259,900-$589,900

                Closed-19 $230,000-$739,900

Financing, median price, and 2,000 or more square feet

Median list price this week $350,000, last week $355,000.  Closed median price this week $345,000, last week $355,000.  A slight change from the week before.  Nothing too drastic.

Fox Valley Real Estate Market update week 35-Stats 090421
Median prices this week

Homes closed using conventional financing this week 281, last week 199. Closed this week using Cash 34, last week 33.  This is out of 387 closed this week.  Conventional is still the what most seller’s are looking for.

Fox Valley Real Estate Market Update Week 35- Conventional and Cash 090421
Conventional and Cash

FHA this week 46, last week 34.  VA this week 25, last week 7.  It is great to see more of FHA and VA getting accepted and closed.  They have really struggled to get through earlier this year.  So many of those buyers gave up.  So I hope they will start looking again.

Fox Valley Real Estate Market Update Week 35-FHA and VA 090421
FHA and VA Financing

Out of 387 closed this week 237 of them were 2,000 square feet or more.  The median closed price was $420,000 this week, last week it was $423,550.  Not much difference there.  Minimum closed price was $140,000 this week with list price of $150,000.  This gives you an idea of what 2,000 square feet or more costs you here in the Fox Valley area of Illinois.

Fox Valley Real Estate Market Update Week 35-2000 sf or more 090421
2,000 square feet or more

Contracts accepted this week

Contracts accepted this week were down.  251 this week compared to 286 the week before.  The market should pick back up again after the Labor Day weekend.

Fox Valley Real Estate Market Update Week 35-Contacts accepted this week
Contracts accepted this week

Look at the communities seller’s accepted the most contracts:

Aurora-43                             Bolingbrook-26

Montgomery-12                     Naperville-26

Plainfield-30                         St Charles-15

West Chicago-12                   Yorkville-16

1 short sale was accepted this week.  It was in Plainfield.  Now it will be submitted to the lender to see if they will also accept it.  Most homeowners that are having trouble paying their mortgage can sell without doing a short sale.  The prices have increased enough that most of them can sell and might even get some money at closing to move.

Seller’s have accepted contracts that are contingent on the buyer closing on their current home.  7 with a kick-out clause of 72 hours, 5 with 48 hours and 1 with 24 hours.

Also, seller’s have accepted contracts that are contingent on the buyer selling and closing on their current home.  5 with a kick-out clause of 72 hours, 1 with 48 hours and 2 with 24 hours.

2021 by the month

Month              New     Closed     Contracts accepted

January                    543            649                 829

February                   561            604                 778

March                       993          1099                1455

April                        1006            926                1387

May                         1088           1228                1289

June                        1450           1686                1671

July                          1118            1182                1210

August                     1109            1203                1170

September                204             387                  251

Totals               8072          8964               10040

Single family homes have been selling.  It has been a good year with a very tight market so far.  Check back with us every Saturday for the real estate market update.  At the end of each month we take a look back at 2020 and 2019 as well so you can see how things have been going.

Contact us

Call us at 630-503-6555 with all of your real estate questions.  Your goal is our goal.  We will do everything we can to help you reach your goal.

Request a home valuation if you are thinking about selling.  Give us a little information about your home and what has been recently updated.  We will provide you with a net proceeds that shows you the expenses to sell.  This will be updated when an offer comes in and we know all the terms so you can make a good decision.

Are you thinking about buying this year?  You need to get with a loan officer and get all your financial information to them so they can get you pre approved.  Seller’s today want to see more than just calling up a loan officer and talking to them on the phone,  They want to know that the loan officer has seen all your information and ran the credit check and put it through underwriting.  It also will make it much faster when you find a home to get the loan approved.

Resources:

If you need recommendations for loan officers, real estate attorneys or home inspectors we can send you a few to contact and you can decide who you want to work with.

Fox Valley real estate market update week 35.  Happy Labor Day weekend!  Enjoy and be safe.

Fox Valley real estate market update week 35-Kristine Heiman Managing BrokerKristine Heiman, SFR, SRS, AHWD

Designated Managing Broker

Best Homes Fox Valley-Search for a home today!

200 Webster St

Montgomery, IL 6038

630-503-6555 ext 101


How many homes closed 2,000 square feet or more week 34

How many homes closed 2,000 square feet or more week 34-Cover

How many homes closed 2,000 square feet or more week 34.  This is one way to search homes that you are looking for if you know less than 2,000 square feet will not work for you.  We will let you know how this week went shortly.

New listings of single family homes was down this week.  221 this week compared to 256 the week before.  So many people are getting the kids in school this past week.  It is a big adjustment especially for the kids that did not attend in-person school last year.  Hopefully things will settle down and get back to thinking about housing.

Closed listings of single family homes were also down.  273 this week compared to 299 the week before.  This is the last full week of the month.  Monday and Tuesday the last days of the month.  We are back to scheduling things around school.  During last year with the pandemic, and kids not attending in-person classes, people were not worrying about the school schedule.

How many homes closed 2,000 square feet or more week 34

Take a a look at the communities with the most activity this week:

Aurora-New 33 $167,500-$690,000

            Closed-43 $90,000-$451,500

Bolingbrook-New 17 $195,000-$415,000

                   Closed-19 $198,000-$544,000

Geneva-New 5 $349,900-$474,000

            Closed-11 $295,000-$680,000

Montgomery-New 8 $212,000-$300,000

                     Closed-10 $217,000-$376,000

Naperville-New 37 $285,000-$1,300,000

                 Closed-52 $245,000-$1,750,000

Oswego-New 11 $249,000-$549,000

             Closed-15 $250,000-$435,900

Plainfield-New 31 $249,000-$774,400

                Closed-40 $180,000-$630,000

St Charles-New 13 $265,000-$990,000

                  Closed-22 $205,000-$990,000

Yorkville-New 12 $219,900-$515,000

               Closed-10 $209,000-$430,000

Financing, median price and 2,000 or more square feet

Median list price this week $355,000, same as the week before.  Closed median price this week $355,000, last week $359,900.  Prices are not changing that much right now.

How many homes closed 2,000 square feet or more week 34-Stats 082821
Median prices this week

Homes closed using Conventional Financing this week 199, last week 218. Cash homes that closed this week 33, last week 24.

How many homes closed 2,000 square feet or more week 34-Conv and cash 092821
Conventional and Cash financing

Homes closed using FHA financing this week 34, last week 47.  VA financing this week 7, last week 10

How many homes closed 2,000 square feet or more week 34-FHA and VA 082821

Out of 273 homes that closed this week 166 of them were 2,000 square feet or more with a median closed price of $423,550, and list price $419,900.   The minimum closed price $207,000 with minimum list price $199,900.  This gives you an idea of what 2,000 square feet costs you here in the Fox Valley area of Illinois.

How many homes closed 2,000 square feet or more week 34-2,000 square feet or more 082821
2,000 square feet or more

Contracts accepted this week

Contracts accepted this week were down.  286 this week compared to 300 the week before.  Hopefully after the adjustment of getting back in the routine of school things will go back to normal.  The market is not down that much.

How many homes closed 2,000 square feet or more week 34-Contracts accepted this week

Look at the communities with the most contracts accepted this week:

Aurora-49                            Bolingbrook-21

Geneva-10                            Montgomery-16

Naperville-35                       Oswego-13

Plainfield-46                        St Charles-19

Sycamore-10                        West Chicago-14

Yorkville-12

No short sales were accepted this week.

Seller’s accepted contracts that are contingent on the buyer to close on their current home.  7 with a kick-out clause of 72 hours, 7 with 48 hours and 3 with 24 hours.

Also, seller’s accepted contracts that are contingent on the buyer selling and closing on their current home.  1 with a kick-out clause of 48 hours.

2021 by the month and a look back at 2020 and 2019

2021

Month                        New     Closed     Contracts accepted

January                       543           649                   829

February                     561            604                   778

March                         993          1099                  1455

April                          1006           926                  1387

May                           1088          1228                  1289

June                          1450          1686                  1671

July                           1118           1182                   1210

August                       1109          1203                   1170  

Totals                     7868          8577                  9789

2020

January                     1105            566                     858

February                   1267            529                   1024

March                        1186            707                   1079

April                           648            786                     775

May                           1352           1010                    1444

June                          1232            908                    1534

July                           1417           1453                    1852

August                      1037           1335                    1436

Totals                9244           7294                  10002

2019

Month            

January                     878              407                     568

February                  1032              463                     832

March                      1731               915                    1375

April                        1594              792                    1307

May                         1645              995                    1280

June                        1643            1253                     1218

July                         1423            1008                     1090

August                     1585            1330                     1196

Totals                     11531            7163                    8866

More homes have been closed this year than the previous 2 years even with a tighter market.  You can see the steady decline in new listings.  Normally, August is the best month for closings right before school starts.  This year it was June.  It has been a really hard year for buyer’s.  They have had so much competition for homes and not many to choose from.  Prices have gone up so much that some have been priced out of the market.  We hope inventory will improve.

Contact us

Call us at 630-503-6555 with all your real estate questions.  Your goal is our goal.  We will do everything we can to help you reach your goal.

Thinking about selling before the holidays?  Request a home valuation and tell us a little bit about your home and what improvements have been recently completed.  We will provide you with a net proceeds that shows you an estimate of expenses to sell.  This will be updated when an offer comes in and we know all the terms.

Do you want to buy a home this year?  You need to contact a loan office that is willing to pre approve you before you find the home.  You need to get them all your financial information.  Pre-qualifying just is not enough anymore.  You need to be ready to go with a letter in hand to go with an offer.  A seller will not consider you without it.  You might also need to show proof of funds.  You can have your financial institution write a letter showing you do have the funds available for the down payment and closing costs.  That might even improve your chances if there is multiple offers.

Resources:

If you need recommendations for loan officer’s, real estate attorney’s or home inspector’s we can give you a few of each and you can decide who you want to work with.

How many homes closed 2,000 square feet or more week 34.  Have a great week!

How many homes closed 2,000 square feet or more week 34-Kristine Heiman Designated Managing BrokerKristine Heiman, SFR, SRS, AHWD

Designated Managing Broker

Best Homes Fox Valley-Search for a home today!

200 Webster St

Montgomery, IL 60538

630-503-6555 ext 101


How many homes closed 2,000 square feet or more week 33

How many homes closed 2,000 square feet or more week 33-Cover

How many homes closed 2,000 square feet or more week 33. So many people are looking for more space.  Can they find it in the price range they are looking for?  We will get into that shortly.

New listings of single family homes were pretty consistent with the week before.  256 this week compared to 251 the week before.  We would love to see more, but consistency is good.

Closed single family homes this week were also, not far off of last week.  299 this week compared to 291 the week before.  Next week is the last full week of the month so they should increase.

How many homes closed 2,000 square feet or more week 33

Take a look at the communities with the most activity this week:

Aurora-New 46 $145,000-$770,000

            Closed-62 $139,000-$595,000

Bolingbrook-New 16 $249,000-$899,000

                    Closed-23 $175,000-$511,000

Geneva-New 9 $268,900-$1,200,000

             Closed-12 $284,000-$766,337

Naperville-New 42 $250,000-$1,625,000

                 Closed-55 $350,000-$2,400,000

Oswego-New 16 $299,999-$449,990

              Closed-12 $211,000-$440,000

Plainfield-New 44 $224,900-$900,000

                Closed-34 $196,000-$555,000

St Charles-New 17 $209,900-$1,895,000

                  Closed-26 $175,000-$915,000

West Chicago-New 10 $295,000-$664,900

                       Closed-7 $239,000-$492,000

Financing, median list and closed price, 2,000 square feet or more closed this week

Median list price this week $355,000, last week $361,470.  Median closed price $359,900, last week $375,000.  These numbers go up and down each week, but they do not change drastically.

How many homes closed 2,000 square feet or more week 33- Stats 082121
Stats for August 21, 2021

Homes that closed using Conventional this week 218, last week 221.  Cash this week 24, last week 33.

How many homes closed 2,000 square feet or more week 33-Conventional and cash
Conventional and Cash

Closed homes using FHA financing this week 47, last week 26.  VA this week 10, last week 9.

How many homes closed 2,000 square feet or more week 33-FHA and VA
FHA and VA financing

Seller’s are still choosing Conventional financing over anything else.  I am encouraged to see FHA numbers going up.  Some buyer’s that have to go FHA have given up.  They are tired of losing out to buyer’s using Conventional financing with multiple offer situations.

Out of 299 homes that closed this week 191 of them were 2,000 square feet or more.  Median list price is $425,000, closed price is $420,000.  Minimum list price $220,000, closed price $242,000.  So many people are looking for more space since the pandemic.  This gives you an idea of what price that will cost you.  If you are below this price it will be hard to find.  You might need to adjust the criteria for the home you are looking for.

How many homes closed 2,000 square feet or more week 33-2000 sf 082121
2,000 square feet or more

Contracts accepted this week

Contracts accepted this week on single family home were consistent.  300 this week compared to 303 the week before.  The market is staying steady.  There might not be as many offers with multiple offer situations, but buyer’s are still out there looking.

Home many homes closed 2,00 square feet or more week 33-contracts accepted this week

Look at the communities seller’s accepted the most contracts:

Aurora-51                          Batavia-10

Bolingbrook-24                  Montgomery-13

Naperville-33                    Oswego-10

Plainfield-37                     St Charles-26

Sycamore-10                     West Chicago-11

Winfield-14                       Yorkville-11

There were no short sales accepted by seller’s this week.  Most people that are in a bind, and need to sell do not have to go through the short sale process with the prices that have increased.

Seller’s accepted contracts that are contingent on the buyer closing on their current home.  5 with a kick-out clause of 72 hours, 4 with 48 hours and 3 with 24 hours.

Also, seller’s accepted contracts that are contingent on the buyer selling and closing on their current home. 2 with a kick-out clause of 72 hours, 8 with 48 hours and 2 with 24 hours.

There was 1 that did not have a kick-out clause that they marked.  So we don’t know about that one.

2021 by the month

Month             New     Closed     Contracts accepted

January                  543            649                   829

February                561             604                   778

March                    993           1099                  1455

April                     1006            926                  1387

May                      1088           1228                  1289

June                     1450           1686                  1671

July                       1118           1182                   1210

August                   887            930                    884

Totals                  7646          8304                  9503

We started out the year with closings from 2020.  They received a contract in 2020 but did not close until 2021.  That is why the closed column is more than the new listings.  You can see it has been a really tight market.  Normally you would see more new listings than closings.

It still remains a seller’s market.  There might be fewer offers with multiple offer situations, but there are still a lot of buyer’s out there ready to go.

There has been an extreme shortage of housing across the country.  Some new homes have been built in our area that have helped.

Contact us

Call us at 630-503-6555 with all your real estate questions.  Your goal is our goal.  We will do everything we can to help you reach your goal.

Request a home valuation if you are thinking about selling your home.  We will provide you with a net proceeds that shows you the expenses to sell.  This will be updated when an offer comes in and we know all the terms.

Are you thinking about buying a home?  You need to get ready first by contacting a loan officer and getting them all your financial information.  You need to get pre approved with this market.  Just calling and talking to a loan officer to get pre-qualified is not enough anymore.  You need to show the seller’s that you have taken this extra step.

Resources:

If you need recommendations for loan officers, real estate attorneys and home inspectors we can give a few of each and you can decide who you want to work with.  Just let us know.

All data used is from our MLS that we use MRED, LLC.

How many homes closed 2,000 square feet or more week 33.  Have a great week!

How many homes closed 2,000 square feet or more week 33-Kristine Heiman Designated Managing BrokerKristine Heiman, SFR, SRS, AHWD

Designated Managing Broker

Best Homes Fox Valley-Search for a home today!

200 Webster St

Montgomery, Il 60538

630-503-6555 ext 101

How many VA deals closed in week 32

How many VA deals closed in week 32-Cover

How many VA deals closed in week 32?  Shortly we will break it down for you what types of financing was chosen most this week.  There are many veterans that live in the Fox Valley area.  We do not know how many VA offers were not accepted, but we do know how many closed this week.
First we will talk about new listings for the week.  New listings were down.  251 this week compared to 264 the week before.  This is making a low inventory situation even worse.
Closed listings were also down.  291 this week compared to 340 the week before.  This will increase as we get closer to the end of the month.

How many VA deals were closed in week 32

Take a look at the communities that had the most activity this week:
Aurora-New 35 $140,000-$599,900
            Closed-37 $97,000-$711,711
Batavia-New 7 $235,000-$650,000
            Closed-15 $185,100-$679,000
Bolingbrook-New 23 $200,000-$507,174
                   Closed-21 $205,000-$488,000
Geneva-New 11 $235,000-$1,295,000
            Closed-19 $256,000-$1,995,000
Naperville-New 37 $299,900-$2,195,000
                 Closed-52 $290,000-$2,225,000
Oswego-New 8 $289,900-$544,900
             Closed-11 $270,000-$522,000
Plainfield-New 41 $255,000-$899,900
               Closed-37 $225,000-$790,000
St Charles-New 20 $275,000-$1,275,000
                  Closed-32 $253,000-$1,250,000
West Chicago-New 10 $214,000-$1,075,000
                      Closed-6 $253,000-$559,000

Financing, median list and closed price

Median list price this week $361,470, and last week $350,000.
Median closed price this week $375,000, and last week $365,000.
The median list and closed prices have been fluctuating up and down, but basically staying in the same range.

How many VA deals closed in week 32-Stats 081421

Conventional deals that closed this week 221, and last week 248.
Cash deals that closed this week 33, and last week 39.
How many VA deals closed in week 32-Conv and Cash 081421
Conventional and Cash
FHA deals that closed this week 26, and last week 41.
VA deals that closed this week 9, and last week 12.
How many VA deals closed in week 32-FHA and VA 081421
FHA and VA
Totals were down in each one.  We do not know how many VA loan offers are not getting accepted, but the trend you can see is seller’s are accepting more Conventional loans then anything else.  Hopefully, it is not that agents are shying away from VA loans because they think they will be  hard or take longer to close.  If a home is in good condition there should be no problem with getting a VA loan approved.  Using a lender that is familiar with the process is very important.

Contracts accepted this week

Contracts accepted this week were up.  303 this week compared to 281 the week before.

How many VA deals closed in week 32-Contracts accepted this week

Look at the communities seller’s accepted the most contracts this week:
Aurora-56                                              Batavia-10
Bolingbrook-24                                      Montgomery-15
Naperville-37                                        Oswego-13
Plainfield-41                                          St Charles-24
West Chicago-16                                   Yorkville-19
No short sales were accepted by seller’s this week.
 
Seller’s accepted contracts that are contingent on the buyer closing on their current home.  4 with a kick-out clause of 72 hours, 6 with 48 hours, and 4 with 24 hours.
Also, seller’s accepted contracts that are contingent on the buyer selling and closing on their current home.  2 with a kick-out clause of 48 hours.

2021 by the month

Month                      New     Closed     Contracts accepted
January                    543        649             829
February                   561        604             778
March                      993       1099           1455
April                      1006        926            1387
May                       1088      1228            1289
June                      1450       1686           1671
July                       1118      1182            1210
August                      515       631             584
Totals                     7274      8005            9203
We started out the year ahead with closed homes.  Deals that were accepted in 2020 that closed in the beginning of the year.  There is usually a gap between new and closed, but not this year.
It continues to be a seller’s market.  We are still seeing multiple offers, but it is not as intense.  We are starting to see price reductions on some of the higher priced homes.
Contact us
Call us at 630-503-6555 with all your real estate questions.  Your goal is our goal.  We will do everything we can to help you reach your goal.

Request a home valuation

if you are thinking about selling your home.  Give us some information about what has been recently updated.  We will provide you with a net proceeds that shows you the expenses to sell so you can see where you are at.  This will be updated when an offer comes in and we know all the terms.

If you are thinking about buying a home, you will want to find a loan officer that will put you through the process to get pre approved.  Getting pre-qualified just is not enough anymore when you are going to be up against multiple offers.  Seller’s will be confident in accepting an offer with a pre approval before they accept an offer with a buyer that has not gone through the process.
Resources:

We can make recommendations of loan officers, real estate attorneys and home inspectors that we have successfully used in the post.  You can decide who you would like to work with.

How many VA deals closed in week 32.  We hope more agents will get informed about VA loans so they will be more confident in accepting a VA offer.  Our veterans deserve to be able to use their benefits.

Have a great week!

How many VA deals closed in week 32-Kristine Heiman, Designated Managing BrokerKristine Heiman, SFR, SRS, AHWD

Designated Managing Broker

Best Homes Fox Valley-Search for a home today!

200 Webster St

Montgomery, IL 60538

630-503-6555 ext 101
How many FHA deals closed in week 31

How many FHA deals closed in week 31-Cover

How many FHA deals closed in week 31?  Some are getting accepted. Not as many as other types of loans.  We will go into more detail in a little bit.

First we will start out with new and closed listings this week and what communities are seeing the most activity.

New listings of single family homes was pretty consistent.  264 this week compared to 265 the week before.  That is pretty consistent!

Closing listings of single family homes was down.  340 this week compared to 365 the week before.  This is still pretty good for the first full week of the month.  Usually it drops down.  Most buyer’s want to close at the end of the month

How many FHA deals closed in week 31

Take a look at the communities with the most activity this week:

Aurora-New 52 $118,000-$479,000

            Closed-45 $90,000-$655,000

Batavia-New 15 $185,000-$939,900

            Closed-10 $255,000-$760,000

Bolingbrook-New 15 $179,900-$515,000

                   Closed-27 $225,000-$555,000

Montgomery-New 11 $190,000-$349,900

                     Closed-17 $185,000-$340,000

Naperville-New 29 $280,000-$1,550,000

                 Closed-73 $282,000-$2,125,000

North Aurora-New 5 $249,900-$424,990

                       Closed-13 $270,000-$493,000

Oswego-New 15 $289,000-$719,900

             Closed-14 $241,000-$623,455

Plainfield-New 36 $174,900-$551,106

                Closed-42 $230,000-$565,000

St Charles-New 18 $159,900-$820,000

                  Closed-23 $150,000-$990,000

West Chicago-New 13 $189,900-$575,000

                      Closed-7 $305,000-$640,000

Yorkville-New 12 $199,900-$739,900

               Closed-14 $230,000-$420,000

Financing and median list and closed price

So many buyer’s out there are having a hard time getting their FHA offers accepted.  Some are getting through.  We will show you how many Conventional, Cash, FHA and VA deals closed.   We will start out showing you the median list and closed price.

The median list price this week is $350,000, and last week it was $373,700.

Closed median price this week is $365,000, and last week it was $390,000.

The median list and closed prices have been fluctuating up and down each week, but have stayed in the same range.

How many FHA deals closed in week 31-Stats 080721
Median List and Closed Price

Conventional deals closed this week 248, and last week 281.

Cash deals closed this week 39, and last week 38.

Conventional was down, but cash stayed consistent.

How many FHA deals closed in week 31-Conv and Cash 080721
Conventional and Cash

FHA deals closed this week 41, and last week 38.

VA deals closed this week 12, and last week 8.

FHA was up slightly, and VA  was slightly down.  A lot of first-time buyer’s are going with FHA financing, and they are having a hard time especially with multiple offer situations.  Hopefully they will get a break soon.

How many FHA deals closed in week 31-FHA and VA 080721
FHA and VA


Contracts accepted this week

Contracts accepted this week were down.  281 this week compared to 297 the week before.  We don’t know what type of financing was chosen until they close.

How many FHa deals closed in week 31-Contracts accepted this week

Look at the communities seller’s accepted the most contracts:

Aurora-45                                Bolingbrook-19

Montgomery-14                        Naperville-35

Oswego-14                               Plainfield-51

St Charles-14                          Sycamore-10

West Chicago-10                     Yorkville-13

1 short sale was accepted buy a seller in St Charles.  It will now be submitted to the lender to see if they will also accept.  With the prices increasing not too many people have to sell for less than what they owe.  This is a great time, if you are in a bind, to sell.

Seller’s accepted contracts that are contingent on the buyer closing on their current home. 1 with a kick-out clause of 72 hours and 8 with 48 hours.

Also, seller’s accepted contracts that are contingent on the buyer selling and closing on their current home.  1 with a kick-out clause of 72 hours, 5 with 48 hours and 2 with 24 hours.

2021 by the month

Month              New     Closed     Contracts accepted

January                   543            649                  829

February                 561             604                  778

March                     993           1099                 1455

April                      1006            926                 1387

May                       1088           1228                 1289

June                      1450           1686                 1671

July                       1118            1182                 1210

August                   264             340                   281

Totals                  7023           7714                 8900

The numbers are so tight.  We started out the year with more closed then new listings, but normally the new listings would have a bigger gap between them and closed.  The contracts accepted is higher, because some homes that get a contract accepted come back on the market because of home inspection or attorney review issues.  Some appraisals are coming in lower than the contract price and it can’t go through without seller dropping price or buyer coming in with the difference in cash.

Contact us

Call us at 630-503-6555 with all your real estate questions.  Your goal is our goal.  We will do everything we can to help you reach your goal.

It is still a seller’s market so if you are thinking about selling, request a home valuation.  We will let you know what it is worth in today’s market.  Provide you with a net proceeds that shows you the expenses to sell so you can see what you have to work with.  This will be updated when an offer comes in and we know all the terms.

Thinking about buying this year?  You need to get in touch with a loan officer to get pre approved.  Get them all our financial information so they can get you through the pre approval process.  Just getting a pre-qualification is just not good enough anymore with most homes having multiple offers.  You need to be ready to go look as soon as a home hits the market and ready to write an offer.  They go fast.

Resources:

Let us know what other information you re looking for. We will point you in the right direction.

If you need recommendations for loan officers, real estate attorney and home inspectors we can provide you with a few so you can  decide who you want to work with.

How many FHA deals closed in week 31.  Have a great week!

How many FHA deals closed in week 31-Kristine Heiman, Designated Managing BrokerKristine Heiman, SFR, SRS, AHWD

Designated Managing Broker

Best Homes Fox Valley-Search for a home today!

200 Webster St

Montgomery, IL 60538

630-503-6555 Ext 101


What financing was the most common for week 30

What financing was the most common for week 30-Cover

What financing was the most common for week 30?  We will fill you in on that shortly.  First we will look at how many new listings of single family homes in the Fox Valley area of Illinois.  New listings were down.  265 this week compared to 289 the week before.

Closed listings of single family homes were up.  365 this week compared to 306 the week before.  A great ending to the month of July.

What financing was the most common for week 30-New an Closed
New and Closed listings

Take a look at the communities with the most activity this week:

Aurora-New 40 $160,000-$770,000

            Closed-49 $100,000-$725,000

Batavia-New 11 $265,000-$775,000

            Closed-8 $265,000-$700,000

Bolingbrook-New 22 $195,900-$498,900

                    Closed-23 $200,000-$535,000

Geneva-New 15 $240,000-$695,000

            Closed-17 $324,000-$861,606

Montgomery-New 6 $220,000-$345,000

                     Closed-14 $200,000-$390,000

Naperville-New 38 $224,900-$1,500,000

                 Closed-67 $290,000-$1,335,000

Oswego-New 11 $215,000-$699,500

              Closed-15 $232,000-$540,000

Plainfield-New 37 $214,900-$675,000

                Closed-46 $188,000-$680,000

St Charles-New 18 $185,000-$2,350,000

                  Closed-39 $195,000-$1,845,000

Yorkville-New 9 $39,900-$590,000

               Closed-13 $243,000-$577,000

If you are looking to buy and did not see the price range you are looking for in these communities click on the picture to see the other communities and see if you find your price range there.

As you can see from the communities listed that only one community had more new listings than closed.  That was Batavia.  It will continue to be a seller’s market until this tips the other way.

What financing was the most common for week 30?

It makes a big difference in what financing you choose to go with.  Of course cash is king if the price is right, but not everyone has that opportunity.

What financing was the most common for week 30-Conv cash 073121
Conventional and Cash

Conventional financing this week 281 last week 238.

Cash this week 38 last week 27

What financing was the most common for week 30-FHA VA 073121
FHA and VA

FHA this week 38 last week 36

VA this week 8 last week 5

So many people are using Conventional financing, because that is what the seller’s are choosing when they have multiple offers.  FHA and VA are harder to get accepted even if you are not asking for help with closing costs.

It has been hard for buyers that need to use FHA financing.

Median list price this week $373,700 last week $360,000.

Median closed price this week $390,000 last week $379,000.

What financing was the most common for week 30-Stats 073121

As prices increase more buyers are left out of the market.  It is wonderful for seller’s.

Contracts accepted this week

Contracts accepted this week were down.  297 this week compared to 322 the week before.

What financing was the most common for week 30-Contracts accepted this week

Look at the communities seller’s accepted the most contracts:

Aurora-42                        Bolingbrook-25

Geneva-19                        Montgomery-12

Naperville-41                   Oswego-17

Plainfield-34                    St Charles-27

West Chicago-10              Yorkville-10

No short sales were accepted by seller’s this week.

Seller’s accepted contracts that are contingent on the buyer closing on their current home.  3 with a kick-out clause of 72 hours, 4 with 48 hours and 1 with 24 hours.

Also, seller’s accepted contracts that are contingent on the buyer selling and closing on their current home.  2 with a kick-out clause of 72 hours, 3 with 48 hours and 2 with 24 hours.

2021 real estate market update so far this year and a look back at 2020 and 2019

2021

Month               New     Closed     Contracts accepted

January             543          649               829

February           561           604               778

March               993         1099              1455

April                1006          926              1387

May                 1088         1228              1289

June                1450         1686              1671

July                  1118         1182               1210

Totals             6759         8191               8619

2020

January           1105           566                858

February         1267           529              1024

March             1186            707              1079

April                648            786                775

May                1352           1010              1444

June               1232            908              1534

July                1417           1453              1852

Totals            8207          5959              8566

2019

January           878            407                568

February        1032            463                832

March             1731            915               1375

April               1594           792               1307

May                1645           995               1280

June               1643         1253                1218

July                1423         1008                1090

Totals            9946         5833               7670

So many more homes were closed this year than the previous 2 years.  New listings steadily declined from 2019 until this year.  Inventory of homes were low in 2019, but look where they are this year.  This is why the prices have increased so much.

Communities need to increase housing either with new construction or repurposing commercial property to help increase inventory so buyers have a chance.

Contact us

Call us at 630-503-6555 with all your real estate questions.  Your goal is our goal.  We will do everything we can to help you reach your goal.

Request a home valuation if you are thinking about selling your home.  We will let you know what your home is worth in today’s market. A net proceeds, showing you the expenses to sell, will be provided so you can see where you are at.  When an offer comes in this will be updated when we know all the terms so you can make a good decision.

Thinking about buying a home?  You need to contact a loan officer and get them all your financial documents so they can get you pre approved.  You need to take this extra step, because seller’s want to see that your information has been submitted to an underwriter, and that you have been checked out.

Resources:

We will guide you through the process. 

Do you need recommendations for real estate attorneys, home inspectors or loan officers?  We can recommend a few so you can decide who you want to work with.

What financing was most common for week 30 was conventional.  It will continue to be until this market changes and we start getting more homes on the market.

All data was obtained by connect MLS MRED, LLC.

Have a great week!  Let us know how we can help you.

What financing was the most common for week 30-Kristine Heiman, Designated Managing BrokerKristine Heiman, SRS, SFR, AHWD

Designated Managing Broker

Best Homes Fox Valley-Search for a home today!

200 Webster ST

Montgomery, IL 60538

630-503-6555 ext 101

2021 Real Estate Market Update Week 29

2021 Real Estate market update week 29 Cover

2021 real estate market update week 29.  Welcome back!  Other places you can get the percentages up or down over all for the week.  We go into a deeper dive into the numbers.  You might be just keeping an eye on your community to see how it is doing or you might be looking for a home and this might persuade you to look at different communities.  Let us know what information is most important to you.

New listings of single family homes was up slightly.  289 this week compared to 277 the week before.  It seemed towards the end of the week more listings were coming on the market.

Closed listings of single family homes were pretty consistent.  306 this week compared to 305 the week before.  Next week is the last week of the month when most buyers want to close.

2021 Real Estate Market Update Week 29

Take a look at the communities with the most activity this week:

Aurora-New 33 $115,000-$598,900

               Closed-40 $130,000-$575,000

Batavia-New 10 $219,900-$449,900

                Closed-13 $260,000-$650,000

Bolingbrook-New 18 $214,900-$485,000

                        Closed-23 $217,500-$522,000

Geneva-New 13 $260,000-$579,900

                Closed-14 $297,000-$576,000

Montgomery-New 10 $130,000-$339,000

                         Closed-6 $185,000-$330,000

Naperville-New 60 $249,999-$2,150,000

                     Closed-61 $177,500-$1,725,000

North Aurora-New 10 $208,500-$480,000

                          Closed-4 $200,500-$410,000

Oswego-New 9 $210,000-$610,000

                 Closed-14 $251,000-$465,000

Plainfield-New 42 $199,900-$600,000

                    Closed-37 $210,000-$630,000

St Charles-New 24 $215,000-$993,000

                      Closed-23 $222,500-$1,800,000

West Chicago-New 14 $190,000-$825,000

                          Closed-16 $193,000-$582,750

Financing used, median list and closed price

Median list price of single family homes was $360,000 this week compared to $359,900 the week before.

Median closed price of single family homes was $$379,000 this week compared to $355,000 the week before.

2021 Real Estate Market Update Week 29-Stats 072421
Stats this week

Financing choices on closed single family homes this week using Conventional this week 238 and last week 232. Cash this week 27 and last week 28.

2021 Real Estate Market Update Week 29-Conventional and cash Closed
Conventional and Cash

Financing choices on closed single family homes this week using FHA this week 36 and last week 39. VA this week 5 and last week 6.

2021 Real Estate Market Update Week 29-FHA and VA
FHA and VA

Contracts accepted this week

Contracts accepted this week by seller’s on single family homes was pretty consistent.  322 this week compared to 321 the week before.  Consistency in the market is a wonderful thing.  Some talk about it slowing a bit.  Maybe there are not as many offers on a property as there was, but buyers are still out there looking to buy.  It continues to be a seller’s market here in the Fox Valley area of Illinois.

2021 Real Estate Market Update Week 29-Contracts accepted this week

Look at the communities seller’s accepted the most contracts:

Aurora-53                           Batavia-13

Bolingbrook-23                  Geneva-10

Montgomery-12                 Naperville-50

Oswego-14                         Plainfield-46

St Charles-27                   Yorkville-14

No short sales were accepted by seller’s this week.  That does not mean that they are not out there.  Most people that need to sell, that normally would be selling short, have had enough price appreciation that they can sell and payoff the loan. 

Seller’s accepted contracts that are contingent on the buyer closing on their current home.  3 with a kick-out clause of 72 hours, 10 with 48 hours and 4 with 24 hours.

Also, seller’s accepted contracts that are contingent on the buyer selling and closing on their current home.  2 with a kick-out clause of 72 hours and 3 with 48 hours.

2021 real estate market by the month

Month                      New     Closed     Contracts accepted

January                  543          649                   829

February                561           604                   778

March                      993        1099                 1455

April                       1006          926                 1387

May                        1088         1228                1289

June                      1450         1686                 1671

July                         853           817                    913

Totals                   6494       7009                  8322

So far June is the best month across the board.  Closed homes is the most important column to keep track of because this is actual numbers.  Some seller’s can accept a contract but because of many reasons it can go back on the market..

Contact us

Call us at 630-503-6555 with all your real estate questions.  Your goal is our goal. We will do everything we can to help yo reach your goal.

Is it the right time to make a move?  Request a home valuation and give us a little information about your home and what updates have been completed.  We will provide you with a net proceeds that shows you the expenses to sell and you decide if it is the right time.  This will be updated when an offer comes in and we know all the terms.

Thinking about buying this year?  You need to contact a loan officer and give them all your financial information so they can get you pre approved. You need to take this extra step if you want to even be considered by a seller.  We can set you up to receive listings as they hit the market so you don’t miss out on a thing.

Resources:

Need recommendations for a real estate attorney, loan officers or home inspectors?  Just let us know and we will recommend a few for you to contact and decide who you want to work with.

All data used is from our MLS MRED, LLC

2021 real estate market update week 29.  Have a wonderful week!

2021 market update week 29-Kristine HEiman, Designated Managing BrokerKristine Heiman, SFR, SRS, AWHD

Designated Managing Broker

Best Homes Fox Valley-Search for a home today!

200 Webster St

Montgomery, IL 60538

630-503-6555 ext 101
 

2021 Real Estate Market Update Week 28

2021 Real Estate market update week 28 Cover

2021 real estate market update week 28.  Welcome back!  We are here to give you as much information as we can about the market here in the Fox Valley area of Illinois.

New listings of single family homes were down.  277 this week compared to 287 the week before.  Any decrease, even if it is small, is not good.  There just is not enough homes on the market.

Closed listings of single family homes were way up.  305 this week compared to 206 the week before.  As we head into the end of the month they should increase.

2021 Real Estate Market Update Week 28

Take a look at the communities with the most activity this week:

Aurora-New 40 $142,000-$739,000

            Closed-49 $165,000-$615,000

Batavia-New 7 $274,900-$524,900

             Closed-10 $335,000-$960,000

Bolingbrook-New 26 $175,000-$499,900

                    Closed-19 $205,250-$774,900

Geneva-New 8 $249,900-$763,000

             Closed-16 $195,000-$860,000

Montgomery-New 6 $165,000-$292,500

                     Closed-14 $167,350-$361,000

Naperville-New 47 $278,000-$1,990,000

                 Closed-46 $240,000-$1,400,000

North Aurora-New 2 $199,900-$339,900

                      Closed-10 $291,000-$462,000

Oswego-New 15 $300,000-$525,000

              Closed-14 $177,000-$610,000

Plainfield-New 38 $225,000-$1,000,000

                Closed-40 $250,000-$640,000

St Charles-New 20 $279,990-$1,395,000

                  Closed-19 $185,000-$696,000

Sycamore-New 11 $259,900-$549,900

                  Closed-12 $140,000-$615,000

Yorkville-New 15 $267,500-$449,000

               Closed-7 $285,000-$430,000

To see the other communities click on the photo above to enlarge.  You might need to look in communities around where you would like to live to find something.  If you are looking by school district or a certain subdivision we can set you up to receive listings in those areas.  Just let us know what you are looking for.

Median price and type of financing 

Single family homes median list price this week was $359,900, and last week it was $379,900

Median closed price of single family homes this week was $355,000, and last week it was $370,000.

2021 Real Estate Market Update Week 28-Stats 071721

Financing of single family homes that closed this week:

Conventional-232

Cash-28

FHA-39

VA-6

Financing of single family homes the week before:

Conventional-153

Cash-25

FHA-26

VA-4

I decided to add this so you can see what type of financing most buyer’s are using right now to get their offer accepted.

2021 Real Estate Market Update Week 28-Conventional and Cash
Conventional and Cash
2021 Real Estate Market Update Week 28-FHA and VA
FHA and VA

Contracts accepted this week

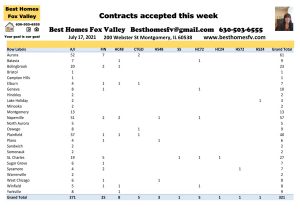
Contracts accepted this week on single family homes were up.  321 this week compared to 270 the week before.

2021 Real Estate Market Update Week 28-Contracts accepted this week 

Look at the communities that seller’s accepted the most contracts this week:

Aurora-61                                 Bolingbrook-23

Geneva-10                               Montgomery-13

Naperville-57                           Plainfield-40

St Charles-27

1 short sale was accepted this week by a seller.  It was in St Charles. Now it will be submitted to the lender to see if they will also accept.

Seller’s accepted contracts that are contingent on the buyer closing on their current home.  5 with a kick-out clause of 72 hours, 8 with 48 hours and 1 with 24 hours.

Also, seller’s accepted contracts that are contingent on the buyer selling and closing on their current home.  1 with a kick-out clause of 72 hours, 3 with 48 hours and 1 with 24 hours.

2021 real estate market by the month

Month                         New     Closed     Contracts accepted

January                        543           649                 829

February                      561           604                 778

March                          993          1099               1455

April                           1006            926               1387

May                            1088         1228               1289

June                           1450         1686               1671

July                              564            511                 591

Totals                         6205          6703               8000

You can see on the contracts accepted column, that contracts have been accepted more than once on a home.  Sometimes because of inspection issues, appraisal issues or loan did not get approved.

Closed is the most important column. These are actual numbers.  At the end of each month I will compare to 2020 and 2019 so you can get a better idea of how this year is going.

Contact us

Call us with all your real estate questions.  Your goal is our goal.  We will do everything we can to help you reach your goal.

Thinking about selling in this wonderful seller’s market?  Request a home valuation and tell us a little bit about your home.  What updates have you completed.  We will provide you with a net proceeds that shows you the expenses to sell.  This will be updated when an offer comes in and we know all the terms.

Are you wanting to buy a home?  You need to get pre approved with a loan officer first.  Get them all your financial information.  You have to be ready to go or you will lose out.  You will be up against multiple offers.

Resources:

If there is still information that you are looking for just let us know, and we will point you in the direction to the information.

All data used here is from our MLS MRED  LLC.

2021 real estate market update week 28.  Have a great week!

2021 market update week 28-Kristine HEiman, Designated Managing BrokerKristine Heiman, SFR, SRS, AWHD

Designated Managing Broker

Best Homes Fox Valley-Search for a home today!

200 Webster St

Montgomery, IL 60538

630-503-6555 ext 101

2021 Real Estate Market Update Week 27

2021 Real Estate market update week 27 Cover

2021 real estate market update week 27. We are working on the second half of the year now and hope the inventory of homes will improve.

New listings of single family homes was up.  287 this week compared to 239 the week before.  Great news!  We will take any improvement we can get.

Closed listings of single family homes were down.  206 this week compared to 419 the week before.  That is to be expected for the beginning of the month.

2021 Real Estate Market Update Week 27

Take a look at the communities with the most activity this week:

Aurora-New 46 $194,900-$585,000

            Closed-40 $155,000-$900,000

Bolingbrook-New 10 $198,000-$479,000

                    Closed-16 $215,000-$450,000

Elburn-New 11 $162,000-$699,000

            Closed-2 $307,000-$370,000

Geneva-New 9 $252,900-$882,592

              Closed-19 $261,000-$962,152

Naperville-New 63 $299,900-$2,095,000

                 Closed-37 $320,000-$1,209,000

Oswego-New 13 $249,900-$525,000

              Closed-12 $258,000-$485,000

Plainfield-New 34 $220,000-$1,399,000

                Closed-15 $250,000-$596,388

St Charles-New 29 $199,900-$1,449,000

                  Closed-11 $275,000-$900,000

Yorkville-New 11 $219,900-$1,100,000

               Closed-7 $240,000-$565,500

Median price and financing this week

Median list price of single family homes this week was 379,900.  Last week it was $369,504.

Median closed price of single family homes this week was $370,000 same as the week before.

2021 Real Estate Market Update Week 27-Stats 071021

I thought I would add financing this week so you can see what is happening.  I did this a little later this morning than my first download so we have 2 more than what is listed above.

2021 Real Estate Market Update Week 27-Conventional and Cash

The one on the left is Conventional financing.  There were 153 with $379,900 the median closed price.

The one on the right is Cash.  There were 25 with $412,500 the median closed price.

2021 Real Estate Market Update Week 27-FHA and VA

The one on the left is FHA financing.  There were 26 with $291,500 the median closed price.

The one on the right is VA financing.  There were 4 with $417,950 the median closed price.

It is important to see the breakdown of what happening right now.  I will continue to list this so you can see if things start to change.

Contracts accepted this week

Contracts accepted this week were down.  270 this week compared to 325 the week before.  Last week new listings were down so that makes sense.

2021 Real Estate Market Update Week 27-Contracts accepted this week

Look at the communities seller’s accepted the most contracts:

Aurora-46                                   Bolingbrook-21

Montgomery-13                          Naperville-45

Oswego-13                                 Plainfield-39

St Charles-25

No short sales were accepted by seller’s this week.  With the prices going up, even if they need to sell because of not working, most likely they can sell without having to go that route.

Sellers accepted contracts that are contingent on the buyer’s closing on their current home.  9 with a kick-out clause of 72 hours, 6 with 48 hours and 2 with 24 hours.

Also, seller’s accepted contracts that are contingent on the buyer’s selling and closing on their current home. 2 with a kick-out clause of 24 hours.

2021 real estate market update by the month

Month                  New     Closed     Contracts accepted

January                 543           649                 829

February               561           604                 778

March                   993         1099               1455

April                    1006           926               1387

May                    1088         1228               1289

June                   1450         1686               1671

July                      287           206                 270

Totals                 5928         6398                7679

Closed is the most important column to look at.  We started ahead at the beginning of the year with inventory left over from the previous year.  Not all of the contracts accepted will end up closing.  Sometimes they come back on the market after home inspection/attorney review period of after the appraisal comes in.   Prices have increased, and the appraisals don’t always match, so if they can’t come to an agreement the home goes back on the market.

It continues to be a seller’s market.

Contact us

Call us at 630-503-6555 with all your real estate questions.  Your goal is our goal.  We will do everything we can to help you reach your goal.

Thinking about selling this year?  Request a home valuation and let us know a little bit about your home and what you have updated.  We will let you know what it is worth in today’s market and provide you with a net proceeds that shows you the expenses to sell.  This will be updated when an offer comes in and we know all the terms so you can make a good decision.

If you are thinking about buying a home this year you have to call a loan officer and get them all your financial information so they can get you pre approved.  Pre qualify will not do in today’s market.  You will probably be up against other offers when you do find a home so you want to let the seller’s know that you did this extra step.

Resources:

If you need recommendations for loan officers, real estate attorneys and home inspectors just let us know and we will recommend a few for you to choose from.

2021 real estate market update week 27.  Have a great week!

2021 market update week 27-Kristine HEiman, Designated Managing BrokerKristine Heiman, SFR, SRS, AHWD

Designate Managing Broker

Best Homes Fox Valley-Search for a home today!

200 Webster St

Montgomery, IL 60538

630-503-6555 ext 101