Fox Valley home prices October 7th
 Fox Valley home prices October 7th. Temperatures have certainly changed since we changed to the fall season. 50’s for a high and we have seen some mid 30’s for a low.
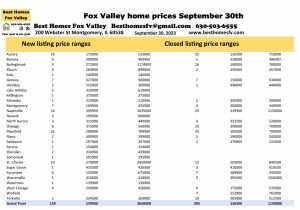
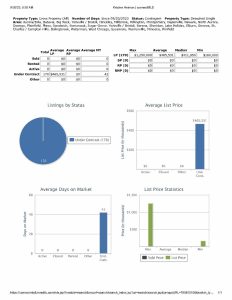
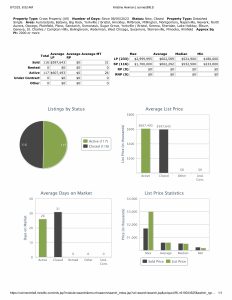
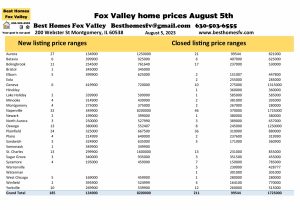
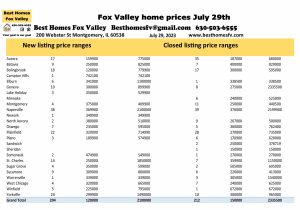
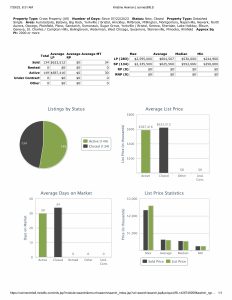
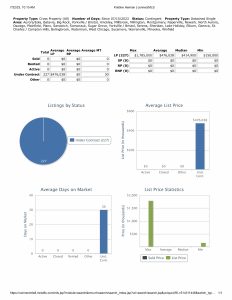
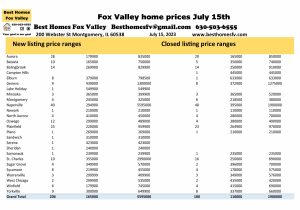
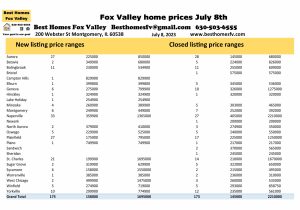
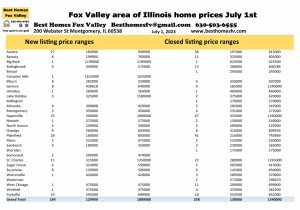
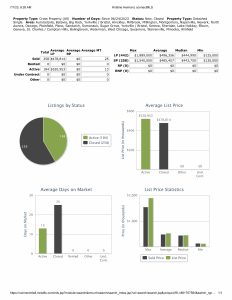
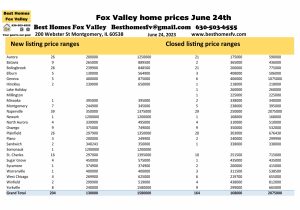
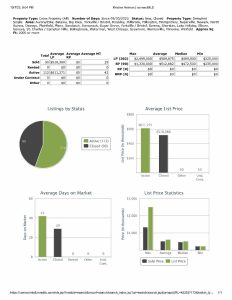
New listings this week are up. 191 this week compared to 159 the previous week.
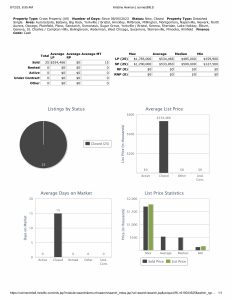
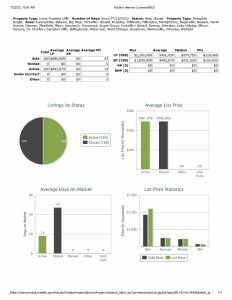
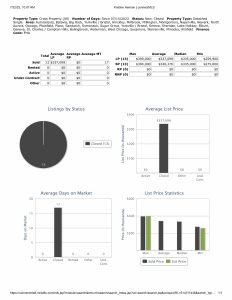
Closed listings are down. 152 this week compared to 205 the previous week.
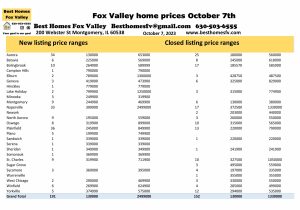
Aurora-New 34 $130,000-$653,000
Closed-25 $180,000-$560,000
Bolingbrook-New 10 $264,900-$589,999
Closed-17 $185,570-$585,000
Naperville-New 33 $399,000-$2,499,000
Closed-17 $372,500-$1,330,000
Oswego-New 8 $319,900-$899,000
Closed-10 $315,000-$565,000
Plainfield-New 36 $245,000-$849,900
Closed-13 $220,000-$790,000
St Charles-New 9 $319,900-$711,900
Closed-10 $327,500-$1,050,000
Yorkville-New 5 $374,990-$575,000
Closed-12 $294,000-$535,000
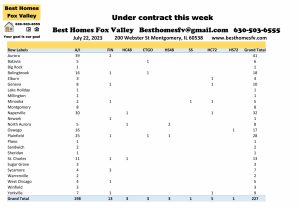
Other communities had activity. Look at the photo above to see what price ranges are in those communities.
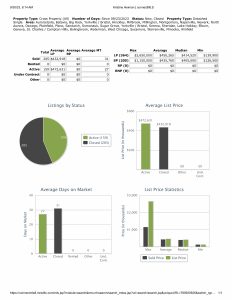
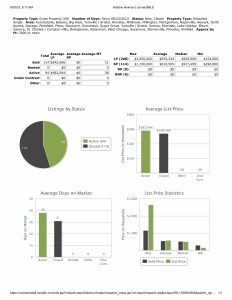
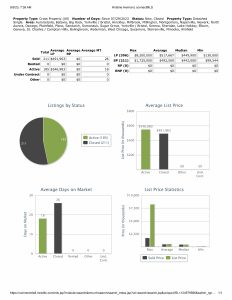
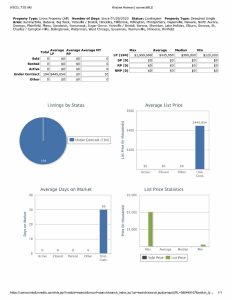
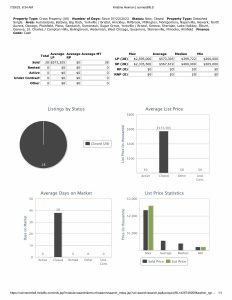
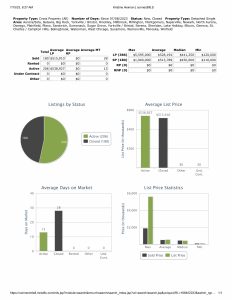
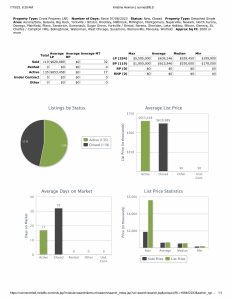
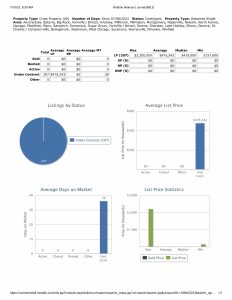
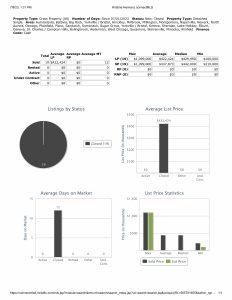
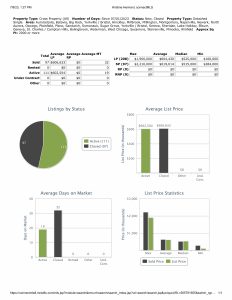
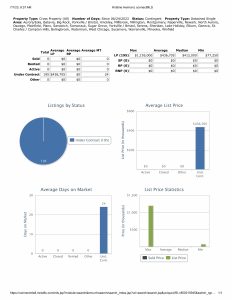
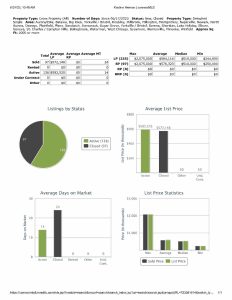
Financing used, median prices, and 2,000 SF or more
Median list price this week $409,900, last week $414, 520.
Median closed price this week $394,950, last week $405,000
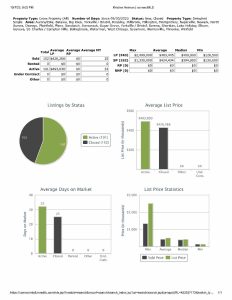
Conventional financing was used to close on 108 homes this week at median price $403, 750 with 26 days average market time, last week 150 homes at median price $410,000 with 32 days average market time.

Cash was used to close on 17 homes at median price $415,000 with 26 days average market time, last week 28 homes at median price $414,950 with 30 days average market time.

FHA financing was used to close on 19 homes this week at median price $305,000 with 23 days average market time, last week 16 homes at median price $322,495 with 33 days average market time.

VA financing was used to close on 6 homes at median price $473,530 with 14 days average market time, last week 8 homes at median price $467,450 with 21 days average market time.

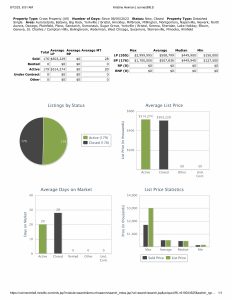
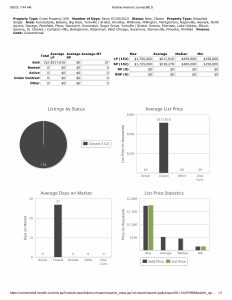
2,000 SF or more closed on 90 homes this week at median price $472,500 with 29 days average market time, last week 114 homes at median price $517,495 with 21 days average market time. Minimum price this week $235,000, last week $290,000.
Conventional financing you can see is still the most used to close on a home. Will we start talking about assuming mortgages if the interest rates keep going up?
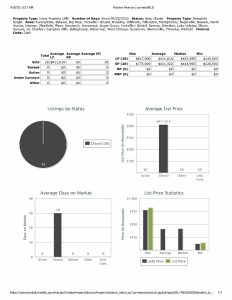
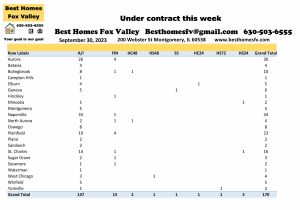
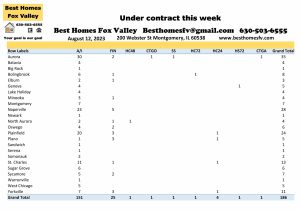
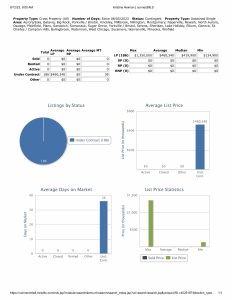
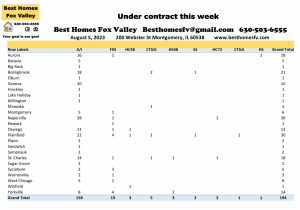
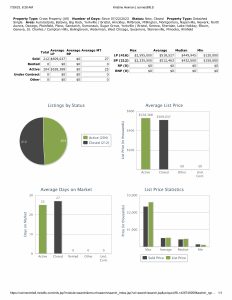
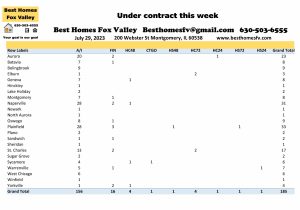
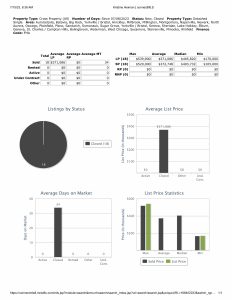
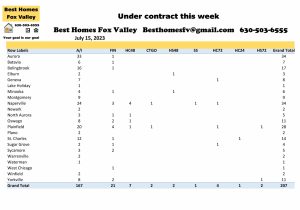
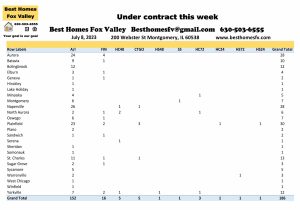
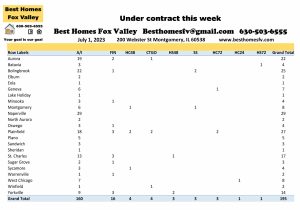
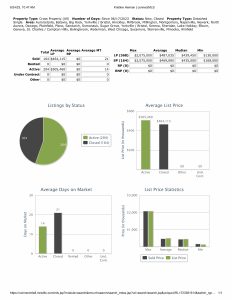
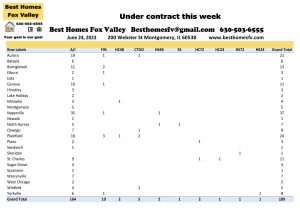
Under contract this week
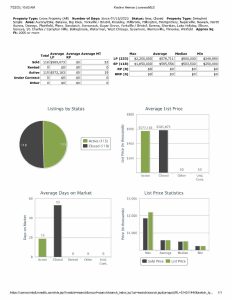
Homes that went under contract this week are down. 156 this week compared to 170 the previous week.
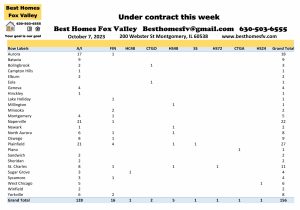
Aurora-18 Naperville-22
Plainfield-27 St Charles-11
1 short sale was accepted this week by a seller. It was in Plainfield. Now it will be submitted to the lender to see if they will also accept.
A seller accepted a contract that is contingent on the buyer closing on their current home. 1 with a kick-out clause of 48 hours.
Also, seller’s accepted contracts that are contingent on the buyer selling and closing on their current home. 1 with a kick-out clause of 72 hours, 5 with 48 hours, and 1 with 24 hours.
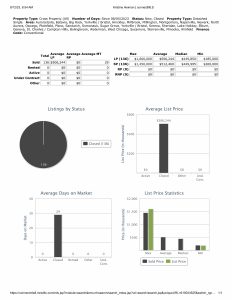
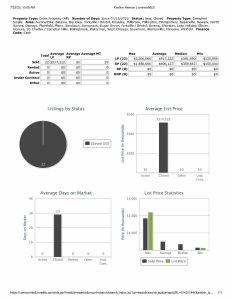
Under contract median price this week $399,900 with 41 days average market time, last week $411,950 with 42 days average market time.

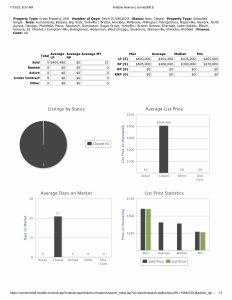
2023 by the month
Month New Closed Under contract
January 483 326 470
February 630 526 789
March 555 558 726
April 710 617 755
May 735 603 816
June 1030 1059 926
July 765 745 805
August 869 988 915
September 684 621 623
October 191 152 156
Totals 6652 6195 6981
We normally post this every Saturday. Occasionally we get too busy and post as soon as we can. We did download all data on Saturday though. All data comes from our MLS, MRED, LLC.
At the end of each month we will also take a look at the previous 2 years 2022 and 2021 so you have something to compare to.
Resources
Please click on each bold and underlined post to take you to the information.
- Types of loans and the process
- VA loans and the requirements
- Down payment assistance
- IHDA programs
- Request home valuation
- Sign-up for email alerts
- Search for a home anytime
If you are looking for any other information that is not listed let us know at besthomesfv@gmail.com and we will point you in the right direction.
Contact us
Call us at 630-503-6555 with all your real estate questions. Your goal is our goal.
We can give you a few loan officers to contact, real estate attorneys and home inspectors. Of course, if you already know someone that is great!
Fox Valley home prices October 7th. Have an awesome week!
Kristine Heiman, Designated Managing Broker
SFR, SRS, SRES, AHWD
200 Webster St
Montgomery, IL 60538
630-503-6555 Ext 101