Fox Valley home prices November 16th

Fox Valley home prices November 16th

Fox Valley home prices November 16th.  Cloudy day today in the 50’s.  This next week we will see between 40 degrees to 60 for highs and lows from 54 to 31 degrees.

New listings this week are down.  166 this week compared to 191 the previous week.

Closed listings are up.  169 this week compared to 143 the previous week.

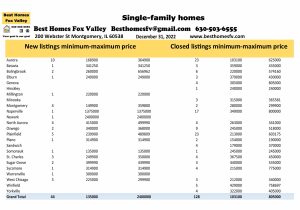
Here are the communities with the most activity this week.

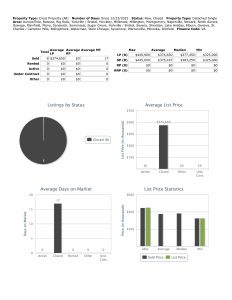
Aurora-New 14 $69,000-$819,900

             Closed-28 $145,000-$1,025,000

Bolingbrook-New 9 $320,000-$539,900

                    Closed-14 $270,000-$531,000

Elgin-New 13 $159,900-$629,990

         Closed-16 $260,000-$678,280

Naperville-New 18 $349,900-$1,250,000

                  Closed-11 $400,000-$1,150,000

Plainfield-New 27 $354,900-$812,000

                Closed-31 $270,000-$952,000

St Charles-New 10 $299,900-$874,900

                  Closed-11 $235,270-$985,000

Look at the photo above to see the other communities that had activity this week and their price ranges.

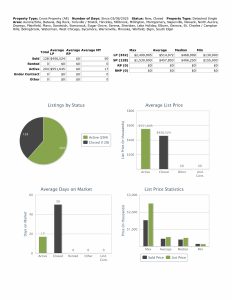
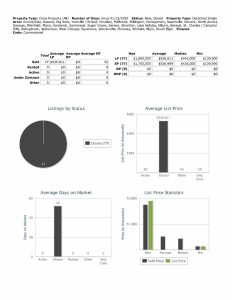
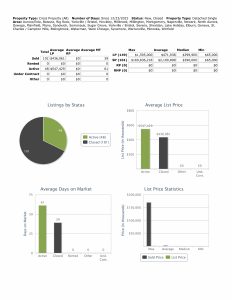
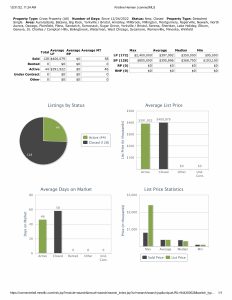
Financing used, median prices, and 2,000 SF or more

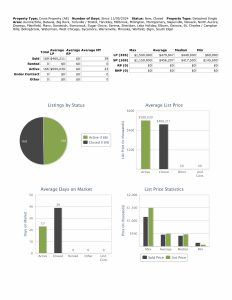
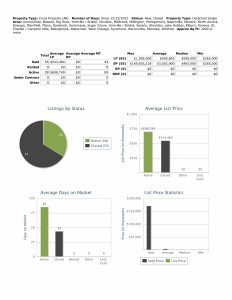
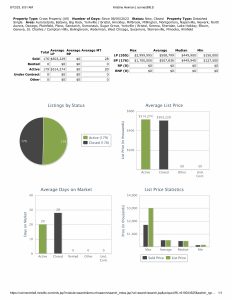
Median list price this week $449,000, last week $448,350.

Closed median price this week $417,500, last week $445,000.

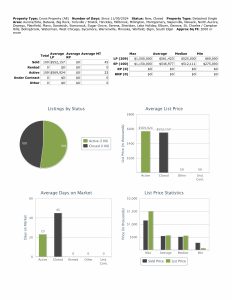
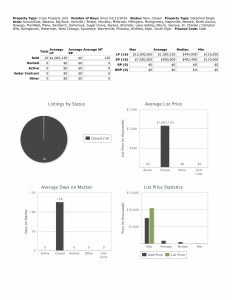
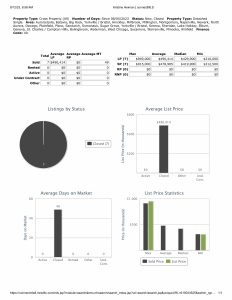
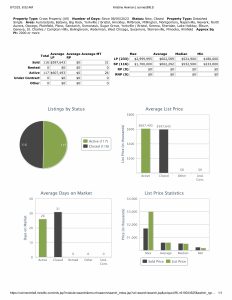
Stats 111624
Stats for week ending November 16th

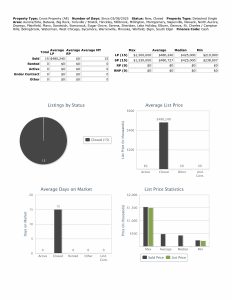
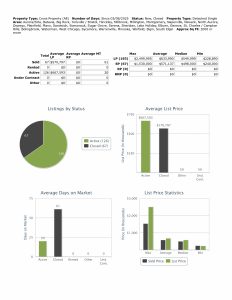
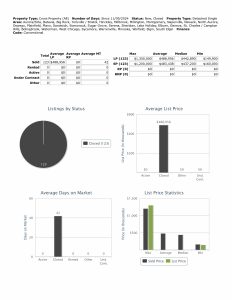
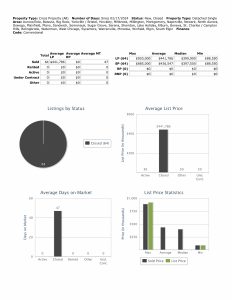
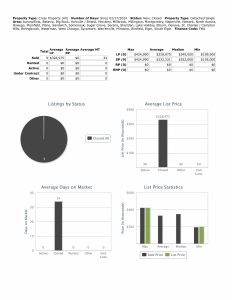
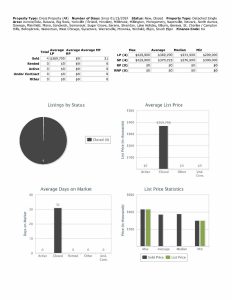
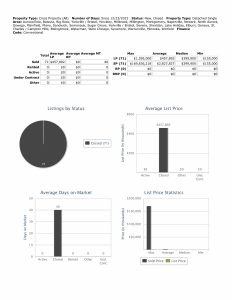
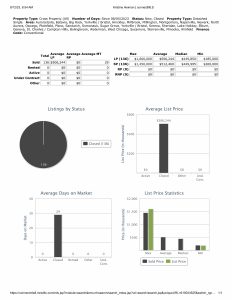
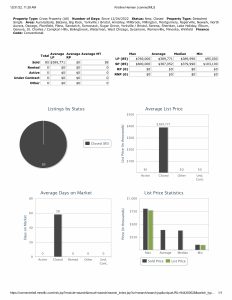
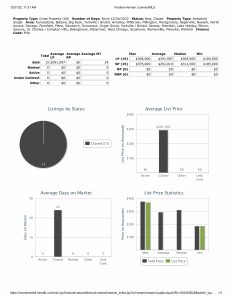
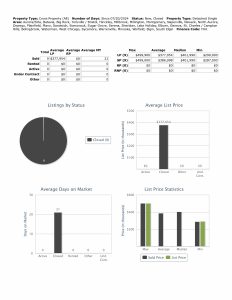
Conventional financing used to close on 123 homes this week at median price $437,200 with 42 days average market time, last week 112 homes at median price $475,000 with 39 days average market time.

Conv 111624
Conventional financing used to close for week ending November 16th

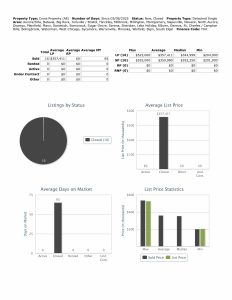
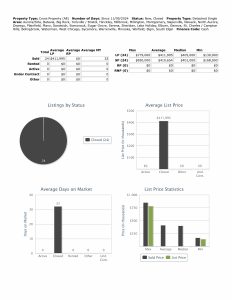
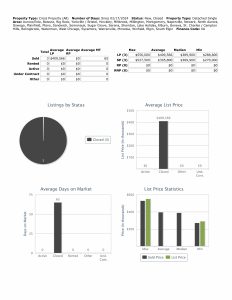
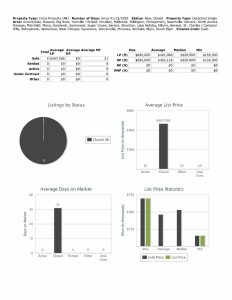
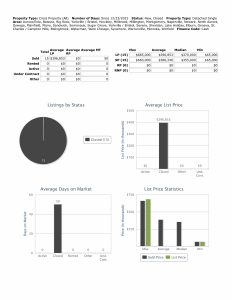
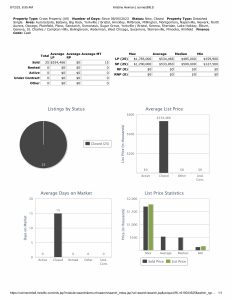
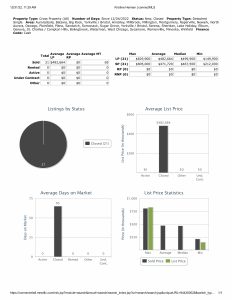
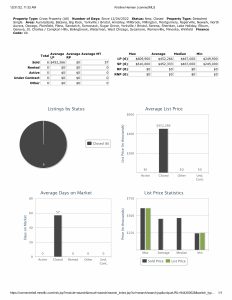
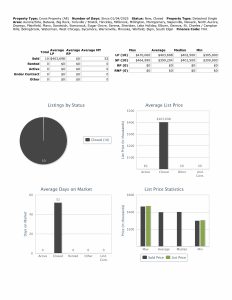
Cash was used to close on 24 homes this week at median price $401,000 with 32 days average market time, last week 23 homes at median price $376,000 with 26 days average market time.

Cash 111624
Cash used to close for week ending November 16th

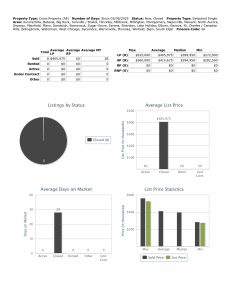
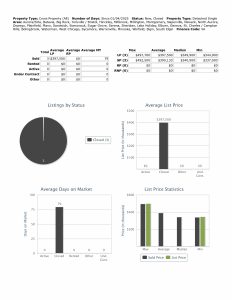
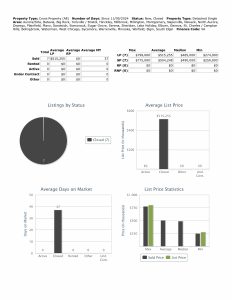
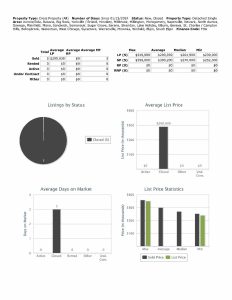
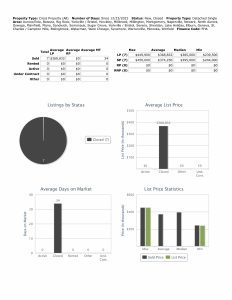
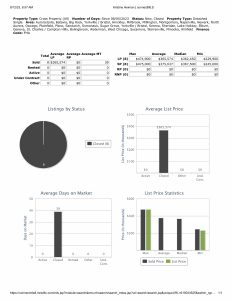
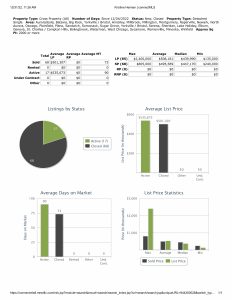
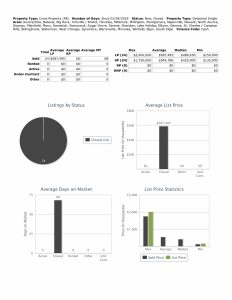
FHA financing was used to close on 15 homes this week at median price $375,000 with 22 days average market time, last week 6 homes at median price $330,000 with 48 days average market time.

FHA 111624
FHA financing used to close for week ending November 16th

VA financing used to close on 7 homes this week at median price $490,000 with 37 days average market time. last week 1 home at $490,000 with 4 days average market time.

VA 111624
VA financing used to close for week ending November 16th

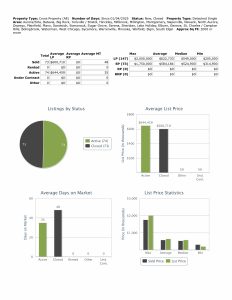
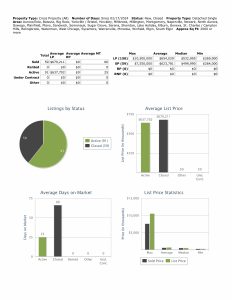
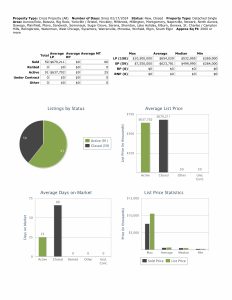
2,000 SF or more closed on 100 homes this week at median price $512,111 with 45 days average market time, last week 92 homes at median price $528,000 with 48 days average market time.  Minimum price this week $275,000, last week $680? (mistake that wasn’t corrected).

2000 SF or more 111624
2,000 SF or more closed for week ending November 16th

Over 72 % of homes closed this week used conventional financing.  59% of homes closed this week were at least 2,000 SF or more.

Under contract this week

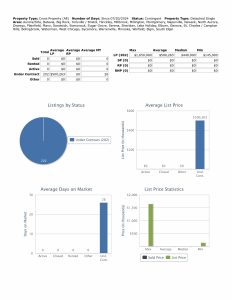
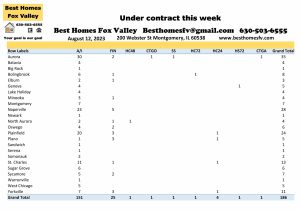
Fox Valley home prices November 16th-Under contract this week

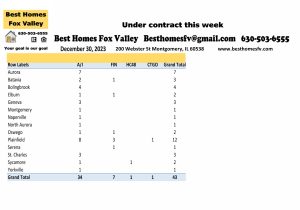
Homes that went under contract this week are consistent.  168 this week compared to 163 the previous week.

Aurora-22                            Bolingbrook-10

Elgin-22                                Naperville-20

Plainfield-19                          St Charles-14

No short sales were accepted by seller’s this week.

Seller’s accepted contracts that are contingent on the buyer closing on their current home.  6 with a kick-out clause of 48 hours and 3 with 24 hours.

Also, seller’s accepted contracts that are contingent on the buyer selling and closing on their current home.  1 with a kick-out clause of 72 hours, 3 with 48 hours, and 1 with 24 hours.

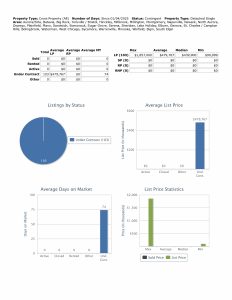
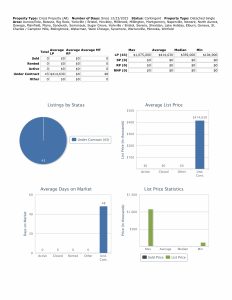
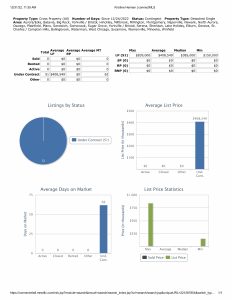
Median price of homes that went under contract this week $399,000 with 48 days average market time, last week median price was $435,000 with 58 days average market time.

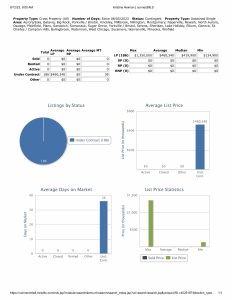
Under contract stats 111624
Under contract stats for week ending November 16th

2024 by the month

Month          New   Closed    Under contract

January              576       523                599

February            637        416                691

March                674        612                792

April                   800       688                801

May                   1077      1002              1075

June                  1009       906                918

July                   1173      1050              1094

August                883       858                725

September          849       734                777

October              990       936                878

November           357        312                331

Totals          9025    8037        8681

There is activity every month of the year.  

Check back with us every Saturday for the real estate market update for the Fox Valley area of Illinois.

At the end of each month we will also take a look back at 2023 and 2022.

Contact us

Call us at 630-503-6555 with all your real estate questions.  Your goal is our goal.

Check out some great information by clicking on everything that is bold and underlined.  It will take you to the information.  If you are looking for other information not listed let us know and we will point you in the right direction.

You can also request a home valuation,sign-up for email alerts, and search for a home anytime.

All data provided today was downloaded from our MLS, MRED, LLC.  It changes throughout the day.

Fox Valley home prices November 16th.  Have an awesome week!

Kristine Heiman, Designated Managing Broker

SFR, SRS, SRES, AHWD

Best Homes Fox Valley

200 Webster St

Montgomery, IL 60538

630-503-6555 Ext 101

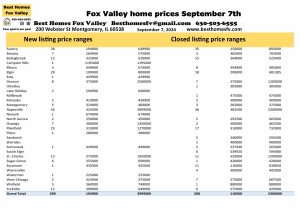
Fox Valley home prices September 7th

Fox Valley home prices September 7th

Fox Valley home prices September 7th.  Next week  we will see temperatures from the 70’s- low 90’s.

New listings this week are consistent.  209 this week compared to 195 the previous week.

Closed listing this wee are slightly down.  208 this week compared to 239 the previous week.

Aurora-New 28 $194,900-$649,900

             Closed-35 $150,000-$893,000

Bolingbrook-New 12 $325,000-$610,000

                      Closed-15 $264,000-$525,000

Elgin-New 20 $199,900-$800,000

          Closed-18 $208,000-$681,385

Naperville-New 45 $425,000-$3,999,000

                    Closed-36 $382,500-$2,300,000

Plainfield-New 23 $319,000-$1,270,000

                  Closed-17 $310,000-$732,800

St Charles-New 13 $375,000-$1,950,000

                  Closed-11 $320,000-$1,200,000

Sycamore-New 1 $435,000

                  Closed-11  $110,000-$630,850

Yorkville-New 12 $399,000-$649,000

                Closed-6 $275,000-$429,900

These are the communities that had the most activity this week.  Look at photo above for the other communities that also had activity for their price ranges.

Financing used, median prices, and 2,000 SF or more

Median list price this week $459,900, last week $459,570.

Closed median price this week $427,450, last week $462,500.

Stats 090724
Stats for week ending September 7th

Conventional financing was used to close on 162 homes this week at median price $438,000 with 25 days average market time, last week 173 homes at median price $475,000 with 27 days average market time.

Conv 090724
Conventional financing used to close for week ending September 7th

Cash was used to close on 27 homes this week at median price $475,000 with 33 days average market time, last week 42 homes at median price $447,950 with 26 days average market time.

Cash 090724
Cash used to close for week ending September 7th 

FHA financing was used to close on 13 homes this week at median price $290,000 with 14 days average market time, last week 13 homes at median price $320,000 with 47 days average market time.

FHA 090724
FHA financing used to close for week ending September 7th

VA financing was used to close on 5 homes this week at median price $375,000 with 19 days average market time, last week 9 homes at median price $445,000 with 17 days average market time.

VA 090724
VA financing used to close for week ending September 7th

2,000 SF or more closed on 120 homes this week at median price $539,460 with 30 days average market time, last week 141 homes at median price $535,550 with 30 days average market time.  Minimum price this week $175,000, last week $207,000.

2000 SF or more 090724
2000 SF or more closed for week ending September 7th

Conventional financing continues to be the most used way to finance a purchase.  I am surprised at the amount of cash deals that we see every week.  

It wasn’t that long ago that the loan officers pre approved buyers using FHA all the time.

Under contract this week

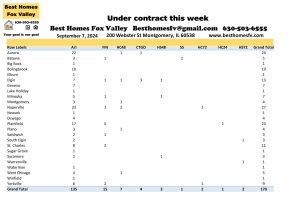
Homes that went under contract this week are pretty consistent.  170 this week compared to 164 the previous week.

Fox Valley home prices September 7th-Under contract this week

Aurora-24                                Bolingbrook-10

Elgin-13                                    Naperville-27

Plainfield-23                            St Charles-11

1 short sale was accepted by a seller this week.  It was in Batavia.  Now it will be submitted to the lender to see if they will also accept.

Seller’s accepted contracts that are contingent on the buyer closing on their current home.  2 with a kick-out clause of 72 hours, 7 with 48 hours, and 1 with 24 hours.

Also, seller’s accepted contracts that are contingent on the buyer selling and closing on their current home.  2 with a kick-out clause of 72 hours and 3 with 48 hours.

Median price of homes that went under contract this week $416,500 with 35 days average market time, last week $419,450 with 37 days average market time.

Under contract stats 090724
Under contract stats for week ending September 7th

Just under 9% of homes had a home contingency.  Either they already have a contract on their home and need it to close to buy or they have not put it on the market yet and need to sell and close to buy.

2024 by the month

Month               New   Closed   Under contract

January              576       523            599

February            637       416             691

March                 674       612             792

April                   800      688             801

May                  1077     1002            1075

June                  1009      906             918

July                    1173     1050           1094

August                883      858             725

September          209      208             170

Totals                7038     6263          6865

Check back with us every Saturday for the real estate market update for the Fox Valley area of Illinois.  At the end of each month we will take a look back at 2023 and 2022 so you have something to compare to.

 Contact us

Call us at 630-503-6555 with all your real estate questions.  Your goal is our goal.

Here are some resources for you to check out.  Click on everything that is bold and underlined to take you to the information.

If there is other information you are looking for just let us know and we will point you in the right direction.

You can alsorequest a home valuationsign-up for email alerts, or search for a home anytime.

All data provided today was downloaded from our MLS, MRED, LLC.  It changes throughout the day.

Fox Valley home prices September 7th.  Have an awesome week!

Kristine Heiman, Designated Managing Broker

SFR, SRS, SRES, AHWD

Best Homes Fox Valley

200 Webster St

Montgomery, IL 60538

630-503-6555 Ext 101
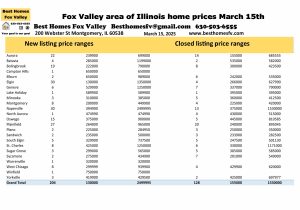
Fox Valley home prices July 27th

Fox Valley home prices July 27th

Fox Valley home prices July 27th.  Typical summer week ahead with temperatures in the 80’s.

New listings this week are consistent.  231 this week compared to 240 the previous week.

 Closed listings are up slightly.  204 this week compared to 181 the previous week.

Aurora-New 33 $185,000-$799,000

             Closed-23 $155,000-$855,000

Bolingbrook-New 10 $265,000-$499,900

                      Closed-12 $287,000-$960,919

Elgin-New 24 $215,000-$999,900

          Closed-24 $136,000-$650,000

Naperville-New 33 $399,000-$3,799,000

                   Closed-32 $425,000-$1,300,000

Oswego-New 11 $340,000-$733,840

               Closed-8 $425,000-$690,000

Plainfield-New 25 $275,000-$685,000

                  Closed-20 $338,000-$675,000

St Charles-New 13 $214,703-$695,000

                   Closed-14 $242,692-$1,045,000

Yorkville-New 12 $344,900-$789,900

                 Closed-5 $161,000-$610,000

Check out the other communities that had activity this week in the photo above and their price ranges.

 Financing used, median prices, and 2,000 SF or more

Median list price this week $459,000, last week $479,000

Closed median price this week $468,500, last week $475,000.

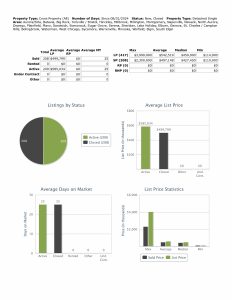
Stats 072724
Stats for week ending July 27th

Conventional financing was used to close on 163 homes at median price $485,000 with 30 days average market time, last week 135 homes at median price $486,000 with 21 days average market time.

Conv 072724
Conventional financing used to close for week ending July 27th

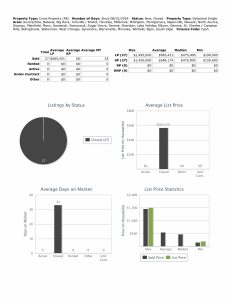
Cash was used to close on 21 homes this week at median price $393,000 with 32 days average market time, last week 23 homes at median price $489,900 with 41 days average market time.

Cash 072724
Cash used to close for week ending July 27th

FHA financing was used to close on 9 homes this week at median price $401,990 with 21 days average market time, last week 14 homes at median price $360,800 with 27 days average market time.

FHA 072724
FHA financing was used to close for week ending July 27th

VA financing was used to close on 7 homes at median price $572,990 with 46 days average market time, last week 7 homes at median price $582,000 with 28 days average market time.

VA 072724
VA financing used to close for week ending July 27th

2,000 SF or more closed on 130 homes at median price $571,495 with 37 days average market time, last week 116 homes at median price $582,000 with 28 days average market time.  Minimum price this week $287,000, last week $235,000.

2000 SF or more 072724
2,000 SF or more closed for week ending July 27th

Conventional financing continues to be the financing to use to close.  Cash continues to beat out FHA financing.

Under contract this week

Homes that went under contract this week are down slightly.  202 this week compared to 231 the previous week.

Fox Valley home prices July 27th-Under contract this week

Aurora-25                    Bolingbrook-18

Elgin-20                       Naperville-37

Plainfield-18                St Charles-14

No short sales were accepted by seller’s this week.

Seller’s accepted contracts that are contingent on the buyer closing on their current home.  1 with a kick-out clause of 72 hours and 5 with 48 hours.

Also, seller’s accepted contracts that are contingent on the buyer selling and closing on their current home.  3 with a kick-out clause of 72 hours, 3 with 48 hours, and 1 with 24 hours.

13 total from both of them is not too many out of 202 that received a contract this week.

Median price of homes that went under contract this week $449,900 with 26 days average market time, last week $425,000 with 30 days average market time.

Under contract stats 072724
Under contract stats for week ending July 27th

2024 by the month

Month            New   Closed   Under contract

January           576        523           599

February         637        416            691

March              674        612            792

April                800       688            801

May                1077      1002          1075

June                1009       906            918

July                 935         754            850

Totals            5708      4901           5726

Check back with us every Saturday for the real estate market update for the Fox Valley area of Illinois.  At the end of each month we will also take a look back at 2023 and 2022.

Contact us

Call us at 630-503-6555 with all your real estate questions.  Your goal is our goal.

Take a look at these great resources.  Click on everything that is bold and underlined to take you to the site for the information.

On my website you will find where you can request a home valuation, sign-up for email alerts, and search for a home anytime.

All data provided today is downloaded from our MLS, MRED, LLC.  It changes throughout the day.

Fox Valley home prices July 27th.  Have an awesome week!

Kristine Heiman, Designated Managing Broker

SFR, SRS, SRES, AHWD

Best Homes Fox Valley

200 Webster St

Montgomery, IL 60538

630-503-6555 Ext 101

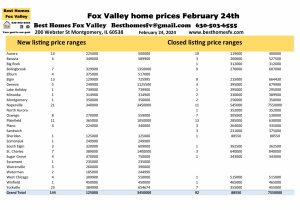
Fox Valley home prices February 24th

Fox Valley home prices February 24th

Fox Valley home prices February 24th.  We have had some fantastic weather for February.  Yesterday it snowed but is already melting today.  We might reach 72 degrees on Tuesday.  Just incredible for February.  We should level off to the 50’s after that.

New listings this week are down.  144 this week compared to 167 the previous week.

Closed listings are consistent.  92 this week compared to 98 the previous week.

Aurora-New 14 $225,000-$500,000

             Closed-10 $119,000-$400,000

Elgin-New 13 $129,900-$725,995

          Closed-8 $215,000-$664,430

Naperville-New 21 $340,000-$3,450 000

                   Closed-11 $545,000-$7,550,000

Plainfield-New 11 $365,000-$1,050,000

                  Closed-13 $285,000-$630,000

Yorkville-New 23 $384,990-$654,674

                Closed-7 $355,000-$455,000

Other communities had activity this week.  Please look at photo above to see the price ranges in those communities.

Financing used, median prices, and 2,000 SF or more

Median list price this week $444,900, last week $469,990.

Closed median price this week $389,900, last week $447,500.

2000 SF or more 022424
Stats for week ending February 24th

Conventional financing was used to close on 64 homes this week at median price $397,500 with 47 days average market time, last week 80 homes at median price $467,495 with 51 days average market time.

Conv 022424
Conventional financing used to close for week ending February 24th

Cash was used to close on 16 homes this week at median price $482,495 with 126 days average market time, last week 5 homes at median price $472,000 with 57 days average market time.

Cash 022424
Cash used to close for week ending February 24th

FHA financing was used to close on 9 homes this week at median price $352,000 with 34 days average market time, last week 9 homes at median price $349,999 with 85 days average market time.

FHA 022424
FHA financing used to close for week ending February 24th

VA financing was used to close on 3 homes this week at median price $389,900 with 65 days average market time, last week 3 homes at median price $350,000 with 71 days average market time.

VA 022424
VA financing used to close for week ending February 24th

2,000 SF or more closed on 59 homes this week at median price $499,990 with 66 days average market time, last week 64 homes at median price $528,000 with 67 days average market time.  Minimum price this week $264,000, last week $267,000.

2000 SF or more 022424
2,000 SF or more homes closed for week ending February 24th

Conventional financing continues to be the way to go still.  Cash seems to be slowing down slightly.

Under contract this week

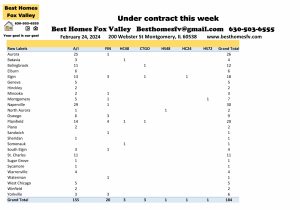
Homes that went under contract this week are up.  184 this week compared to 157 the previous week.

Fox Valley home prices February 24th-Under contract this week

Aurora-26                        Bolingbrook-12

Elgin-18                           Naperville-30

Plainfield-20                   St Charles-11

No short sales this week accepted by seller’s.

Seller’s accepted contracts that are contingent on the buyer closing on their current home.  3 with a kick-out clause of 48 hours and 1 with 24 hours.

Also, seller’s accepted contracts that are contingent on the buyer selling and closing on their current home.  1 with a kick-out clause of 72 hours and 1 with 48 hours.

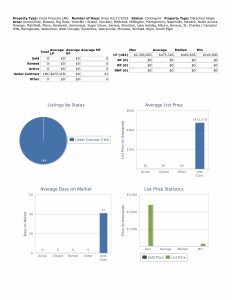
Median price of homes that went under contract this week $440,836 with 41 days average market time, last week $414,900 with 39 days average market time.

Under contract stats 022424
Under contract stats for week ending February 24th

2024 by the month

Month            New   Closed   Under contract

January           576       523             599

February         456       262             518

Totals            1032       785             1117

Check back with us every Saturday for the real estate market update for the Fox Valley area of Illinois.  At the end of each month we will also take a look back at 2023 and 2022 so you have something to compare it to.

 Contact us

Call us at 630-503-6555 with all your real estate questions.  Your goal is our goal.

Information to check out. Click on each one to take you to the information.

All data provided today was downloaded from our MLS, MRED, LLC.  It changes throughout the day.

Fox Valley home prices February 24th.  Have an awesome week!

Kristine Heiman, Designated Managing Broker

SFR, SRS, SRES, AHWD

Best Homes Fox Valley

200 Webster St

Montgomery, IL 60538

630-503-6555 Ext 101
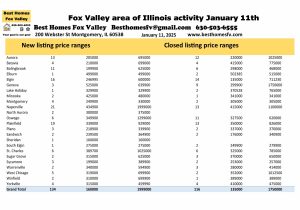
Fox Valley home prices January 20th

Fox Valley home prices January 20th

Fox Valley home prices January 20th.  Bright and sunny today with a high of 13 and a low tonight of -14.  Next week we will get into the 30’s.  I can’t wait!

New listings this week are down.  99 this week compared to 128 the previous week.

Closed listing are consistent.  96 this week compared to 106 the previous week.

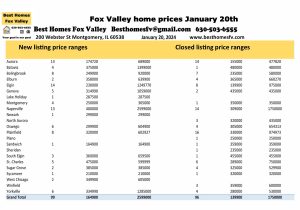
Aurora-New 13 $174,720-$689,000

             Closed-14 $155,000-$477,820

Elgin-New 14 $230,000-$1,249,770

           Closed-8 $139,900-$975,000

Naperville-New 13 $400,000-$2,599,000

                   Closed-14 $309,000-$1,750,000

Plainfield-New 8 $320,000-$602,927

                  Closed-16 $330,000-$974,973

Look at the photo above for other communities that had activity this week and their price ranges.  Things did not completely stop even with the sub-zero temperatures.

Financing used, median prices, and 2,000 SF or more

Median list price this week $429,874, last week $425,000.

Closed median price this week $428,250, last week $356,250.

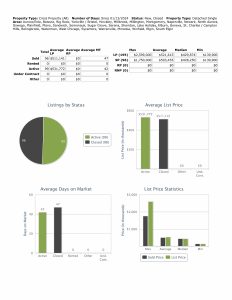
Stats 012024
Stats for week ending January 20th

Conventional financing was used to close on 77 homes this week at median price $435,000 with 52 days average market time, last week 73 homes at median price $375,000 with 37 days average market time.

Conv 012024
Conventional financing used to close for week ending January 20th

Cash was used to close on 9 homes this week at median price $529,900 with 31 days average market time, last week 14 homes at median price $485,500 with 34 days average market time.

Cash 012024
Cash used to close for week ending January 20th

FHA financing was used to close on 5 homes this week at median price $270,000 with 3 days average market time, last week 18 homes at median price $312,500 with 31 days average market time.

FHA 012024
FHA financing used to close for week ending January 20th

VA financing was used to close on 4 homes this week at median price $376,500 with 31 days average market time, last week 1 home at $440,500 with 55 days average market time.

VA 012024
VA financing used to close for week ending January 20th

2,000 SF or more closed on 60 homes this week at median price $529,950 with 39 days average market time, last week 49 homes at median price $450,000 with 40 days average market time.  Minimum price this week  and also last week $250,000.

2000 SF or more 012024
2,000 SF or more homes closed for week ending January 20th

80% of homes closed using Conventional financing this week.  If you do not have cash you need to get approved using Conventional if you want to win.  A pre-approval letter is just not enough right now.  You need to complete the process and get approved.

Under contract this week

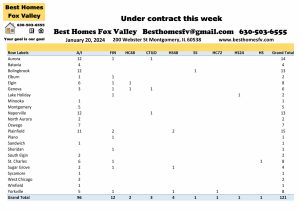
Homes that went under contract this week are slightly down.  121 this week compared to 133 the previous week.

Fox Valley home prices January 20th-Under contract this week

Aurora-14                            Bolingbrook-13

Naperville-13                       Plainfield-15

1 short sale was accepted by a seller this week.  It was in Bolingbrook.  It will now get submitted to the lender to see if they will also accept.

Seller’s accepted contracts that are contingent on the buyer closing on their current home.  1 with a kick-out clause of 72 hours and 2 with 48 hours.

Also, seller’s accepted contracts that are contingent on the buyer selling and closing on their current home.  4 with a kick-out clause of 48 hours, 1 with 24 hours and 1 that we don’t know the timing.

Median price of homes that went under contract this week $402,900 with 57 days average market time, last week median price $397,000 with 62 days average market time.

Under contract stats 012024
Under contract stats for week ending January 20th

2024 by the month

Month                   New   Closed    Under contract

January                   319       286             326

Check back with us every Saturday for the real estate market update for the Fox Valley area of Illinois.  At the end of each month we will also take a look back at 2023 and 2022 so you have something to compare to.

Contact us 

Call us at 630-502-6555 with all your real estate questions.  Your goal is our goal.

All data provided today is downloaded from our MLS, MRED, LLC.  It changes throughout the day.

Information to check out

Fox Valley home prices January 20th.  Have an awesome week!

Kristine Heiman, Designated Managing Broker

SFR, SRS, SRES, AHWD

Best Homes Fox Valley

200 Webster St

Montgomery, IL 60538

630-503-6555 Ext 101
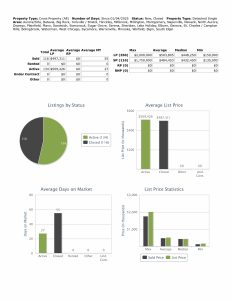
 Fox Valley home prices December 30th

Fox Valley home prices December 30th

Fox Valley home prices December 30th.   Mid 30’s for the next couple of weeks.  More seasonal temperatures then what we have been having.

New listings are slightly up.  48 this week compared to 38 the previous week.

Closed listings are down.  101 this week compared to 126 the previous week.

It is the holidays so things are slower right now.

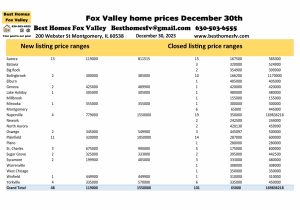
Aurora-New 13 $119,000-$811,515

            Closed-15 $167,500-$585,000

Bolingbrook-New 2 $300,000-$385,000

                    Closed-10 $166,200-$1,170,000

Naperville-New 4 $779,000-$1,550,000

                  Closed-19 $350,000-$169,836,218

Plainfield-New 11 $320,000-$1,050,000

                Closed-14 $287,000-$600,000

Hopefully after the 1st of the year we will see more listings come onto the market.

Financing used, median price, and 2,000 SF or more

Median list price this week $399,900, last week $392,222.

Closed median price this week $390,000, last week $382,500.

Stats 123023
Stats for week ending December 30th.

Conventional financing was used to close on 71 homes this week at median price $399,900 with 40 days average market time, last week 93 homes at median price $412,000 with 46 days average market time.

Conv 123023
Conventional financing used to close for week ending December 30th.

Cash was used to close on 15 homes this week at median price $355,000 with 50 days average market time, last week 21 homes at median price $354,000 with 33 days average market time.

Cash 123023
Cash used to close for week ending December 30th.

FHA financing was used to close on 7 homes this week at median price $395,000 with 34 days average market time, last week 11 homes at median price $318,000 with 22 days average market time.

FHA 123023
FHA financing used to close for week ending December 30th.

VA financing was used to close on 8 homes this week at median price $383,250 with 17 days average market time, last week 1 home at $303,750 with 6 days average market time.

VA 123023
VA financing used to close for week ending December 30th.

2,000 SF or more closed on 55 homes this week at median price $465,000 with 43 days average market time, last week 64 homes at median price $442,500 with 59 days average market time.  Minimum price this week $265,000, last week $268,000.

2000 SF or more 123023
2000 SF or more closed for week ending December 30th.

The majority of the homes closed this week used Conventional financing and half of them were at least 2000 square feet or more.

Under contract this week

Homes that went under contract this week are way down.  43 this week compared to 97 the previous week.

Fox Valley home prices December 30th-Under contract this week

Plainfield-12

No short sales were accepted by seller’s this week.

A seller accepted a contract that is contingent on the buyer closing on their current home.  1 with a kick-out clause for 48 hours.

Median price for homes that went under contract this week $359,000 with 48 days average market time, last week $375,000 with 63 days average market time.

Under contract stats 123023
Under contract stats for week ending December 30th.

2023 and a look back at 2022, 2021, 2020, and 2019

2023              New   Closed    Under contract       

January          483       326               470

February        630       526               789

March             555       558               726

April               710        617                755

May                735        603               816

June              1030       1059               926

July                 765         745               805

August           869         988               915

September     684         621                623

October          639         568               549

November      601          720               610

December       249          497               363

Totals            7950       7828              8347

2022

January           422          492               623

February         523          520               724

March              734          904               890

April               1168          966              1334

May                1101          893               806

June                1295        1409              1234

July                  955          932               908

August            1019         1134             1062

September        730          733              698

October             699          612              646

November         574          764              624

December          257          524              322

Totals               9477       9883             9871

2021

January             543          649             829

February           561           604             778

March                993         1099           1455

April                1006           926           1387

May                 1088          1288          1289

June                 1450          1686           1671

July                  1118           1182            1210

August             1109          1203            1170

September       1083          1411             1251

October              715            973             930

November          557           854             931

December           349         1044             652

Totals              10572        12919          13533

2020

January              1105          566             858

February            1267          529            1024

March                 1186          707            1079

April                   648           786              775

May                   1352         1010            1444

June                    1232          908            1534

July                     1417         1453            1852

August               1037         1335            1436

September          1176        1503            1503

October                843         1116            1159

November            567          985             699

December             513          971              783

Totals                12343      11869           14146

2019

January                878          407              568

February             1032         463              832

March                  1731          915             1375

April                    1594         792             1307

May                     1645         995            1280

June                     1643        1253             1218

July                      1423        1008            1090

August                 1585        1330             1196

September            1164          765              869

October                 1041          738              776

November               897         946              839

December                496         638              497

Totals                    15129      10250          11847

What a difference from 2019 to 2023.  You can see the steady decline in listings.  Supply and demand.  You can see why listings have increased in price.

Contact us

Call us at 630-503-6555 with all your real estate questions.  Your goal is our goal.

All data provided today is from our MLS, MRED, LLC.  It changes throughout the day.

To get information about types of loans and the process, VA loans and the requirements, down payment resource, IHDA programs, request a home valuation, sign-up for email alerts and search for a home go here.

Fox Valley home prices December 30th.  Happy New Year!  Have an awesome week ahead.

Kristine Heiman, Designated Managing Broker

SFR, SRS, SRES, AHWD

Best Homes Fox Valley

200 Webster St

Montgomery, IL 60538

630-503-6555 Ext 101
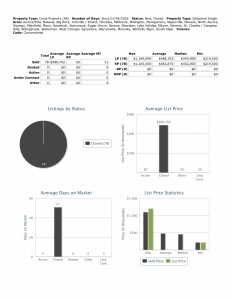
Fox Valley home prices August 12th

bhfv Cover 050623

Fox Valley home prices August 12th.  It looks like a roller coaster with temps for the next couple of weeks.  Highs range from 70-88 during the day and lows from 53-72 at night.  Possible rain on Monday.

New listings are pretty consistent.  179 this week compared to 185 the previous week.

Closed listings are down.  176 this week compared to 211 the previous week.

Aurora-New 28 $187,500-$575,000

             Closed-22 $127,500-$955,000

Bolingbrook-New 14 $255,000-$525,000

                      Closed-12 $233,000-$910,000

Naperville-New 38 $299,000-$2,999,995

                   Closed-29 $270,000-$1,700,000

Plainfield-New 18 $324,900-$845,000

                  Closed-25 $245,000-$1,117,561

St Charles-New 9 $275,000-$659,000

                  Closed-22 $150,000-$1,317,000

Yorkville-New 12 $275,000-$519,990

                Closed-12 $305,000-$915,000

These are the communities with the most activity this week.  Click on the photo above to see the price ranges of other communities that also had activity.

Financing used, median prices, and 2,000 SF or more

Median list price this week is the same as last week $449,900.

Closed listings this week $449,945, last week $442,000.

First week of this year for week ending January 7th median list price was $399,900 and median closed price was $368,000.  What a difference!

Stats 081223
Stats for week ending August 12th

Conventional financing was used to close on 136 homes this week at median price $449,995 with 29 days average market time, last week 152 homes at median price $460,000 with 27 days average market time.

Conv 081223
Conventional financing used to close for week ending August 12th

Cash was used to close on 25 homes this week at median price $500,000 with 15 days average market time, last week 34 homes at median price $414,000 with 22 days average market time.

Cash 081223
Cash used to close for week ending August 12th

FHA financing was used to close on 8 homes this week at median price $367,500 with 39 days average market time, last week 18 homes at median price $368,950 with 9 days average market time.

FHA 081223
FHA financing used to close for week ending August 12th

VA financing was used to close on 7 homes this week at median price $419,900 with 49 days average market time, last week 6 homes at median price $347, 500 with 43 days average market time.

VA 081223
VA financing used to close for week ending August 12th

2,000 square feet or more closed on 116 homes this week at median price $532,500 with 31 days average market time, last week 145 homes at median price $515,000 with 27 days average market time.  Minimum price this week $233,000, last week $245,000.

2000 SF or more 081223
2,000 SF or more closed for week ending August 12th

Under contract this week

Homes under contract this week are consistent.  186 this week compared to 194 the previous week.

Fox Valley home prices August 12th-Under contract this week

Aurora-35                       Naperville-28

Plainfield-24                  St Charles-13

Yorkville-11

1 short sale was accepted by a seller this week.  It was in Aurora.  Now it will be submitted to the lender to see if they will also accept.

Seller’s accepted contracts that are contingent on the buyer closing on their current home.  1 with a kick-out clause of 72 hours, 1 with 48 hours, and 4 with 24 hours.

Also, a seller accepted a contract that is contingent on the buyer selling and closing on their current home.  1 with a kick-out clause of 72 hours.

Median price of homes under contract this week $419,900 with 36 days average market time, last week $389,900 with 30 days average market time.

Under contract 081223
Under contract median price for week ending August 12th

2023 by the month

Month           New   Closed   Under contract

January          483        326            470

February        630        526            789

March             555        558            726

April               710         617            755

May                735        603            816

June               1030      1059            926

July                  765        745            805

August             364       387            380

Totals             5272      4821          5667

Check back with us every Saturday for the real estate market update for the Fox Valley area of Illinois.  At the end of each month we will also take a look back at 2022 and 2021 so you have something to compare to.

Resources

Click on everything that is bold and underlined to take you to the site for the information.  If you are looking for other information not here let us know.  We will point you in the right direction.

If you are wanting to know what your home is worth in today’s market request a home valuation and we will also provide you with a net proceeds that shows you and estimate of expenses to sell.  Many factors go into this so we will update  you when an offer comes in and we know all the terms agreed to.

You can sign-up for email alerts if you want to be informed when a listing comes up with the criteria you are looking for.  You can also keep track of your neighborhood prices.

Search for  a home anytime you like.

All data provided today is from our MLS, MRED, LLC.  It changes throughout the day.

Contact us

Call us at 630-503-6555 with all your real estate questions.  Your goal is our goal.

Fox Valley home prices August 12th.  Have an awesome week!

Kristine Heiman, Designated Managing Broker

SFR, SRS, SRES, AHWD

Best Homes Fox Valley

200 Webster St 

Montgomery, IL 60538

630-503-6555 Ext 101
Fox Valley home prices December 31st

Best Homes Fox Valley Home Prices Header

Fox Valley home prices December 31st.  Happy New Year’s Eve!  If a home is in your plans for 2023, we would love to help you.

The holidays have really slowed things down.  We hope it will start picking up soon in the new year.

We will show you how many new listings, closed, under contract, median prices, financing used, and 2022 by the month and also show you activity in 2021 and 2020 so you can see how this year compared.

New listings this week were down.  44 this week compared to 45 the previous week.  Consistent, but way down.

Closed listings this week were also down.  128 this week compared to 135 the previous week.

Fox Valley home prices December 31st

Aurora-New 10 $168,900-$364,900

             Closed-23 $103,100-$625,000

Naperville-New 1 $1,375,000

                   Closed-17 $349,000-$800,000

Plainfield-New 5 $239,900-$489,809

                 Closed-23 $213,000-$603,175

Click on the photo above to see other communities with activity this week.

Financing used, median prices, and 2,000 SF or more

Median list price this week $350,000, last week $359,945.

Closed median price this week $368,750, last week $346,000.

Stats 123122
Stats for week ending December 31st

Conventional financing was used to close on 85 homes this week at median price $379,990 with 58 days average market time, last week 90 homes at median price $365,000 with 45 days average market time.

Conv 123122
Conventional financing used to close for week ending December 31st

Cash was used to close on 21 homes this week at median price $467,500 with 65 days average market time, last week 22 homes at median price $265,000 with 63 days average market time.

Cash 123122
Cash used to close for week ending December 31st

FHA financing was used to close on 15 homes this week at median price $311,000 with 24 average market time, last week 16 homes at median price $318,000 with 32 days average market time.

FHA 123122
FHA financing used to close for week ending December 31st

VA financing was used to close on 6 homes at median price $467,000 with 57 days average market time, last week also 6 homes at median price $319,950 with 38 days average market time.

VA 123122
VA financing used to close for week ending December 31st

2,000 square feet or more closed on 68 homes at median price $447,170 with 73 days average market time, last week 77 homes at median price $430,000 with 48 days average market time.  Minimum price this week $240,000, last week $275,000.

2000 SF or more 123122
2,000 SF or more closed for week ending December 31st

Contracts accepted this week

Contracts accepted by seller’s this week are down.  51 this week compared to 88 the previous week.

Plainfield had 7 and Aurora, Batavia, and Bolingbrook had 6.

No short sales were accepted this week.

No contracts were accepted with contingencies on a home close or a home sale and closing this week.

Median price of homes that went under contract this week $385,000 with 62 average market time, last week the median price $349,000 with 48 days average market time.

Contingent Stats 123122
Median price of homes under contract for week ending December 31st

2022 by the month and a look back at 2021 and 2020

2022

Month                      New   Closed   Contracts accepted

January                     422       492              623

February                   523       520              724

March                       734       904              890

April                         1168      966             1334

May                           1101      893              806

June                         1295    1409             1234

July                           955      932              908

August                     1019      1134            1062

September               730        733             698

October                    699        612             646

November                 574        764             624

December                 257        524             322

Totals              9477    9883       9871

2021

January                     543        649            829

February                   561         604            778

March                       993        1099          1455

April                        1006         926          1387

May                         1088        1288          1289

June                        1450        1686          1671

July                          1118         1182          1210

August                     1109         1203          1170

September              1083          1411          1251

October                    715           973           930

November                 557          854            931

December                 349         1044           652

Totals            10572    12919     13553

2020

January                    1105        566            858

February                  1267        529          1024

March                       1186        707          1079

April                          648        786           775

May                          1352       1010          1444

June                         1232        908          1534

July                          1417       1453          1852

August                     1037       1335          1436

September               1176       1503          1503

October                    843        1116           1159

November                 567         985            699

December                 513          971            783

Totals            12343    11869     14146

From 2020 to 2022 look at the difference in the amount of new listings.

Resources

Click on everything that is bold and underlined to take you to the site for the information.

Check with your loan officer to see what interest rate you will be offered.  It depends on your credit score and other things that they will explain to you.

If you are thinking about buying a home this year you will want to get the process started to get your loan approved so you know that no issues will come up at the last minute.  You will be in a better position to get your offer excepted.  This is not just talking to a loan officer over the phone.  This is getting all your information to them.

All data used was downloaded yesterday from our MLS, MRED, LLC.  I didn’t get the chance to finish this until today.

Contact us

Call us at 630-503-6555 with all your real estate questions.  Your goal is our goal.

Fox Valley home prices December 31st.  Happy New Year!

Kristine Heiman, SFR, SRS, SRES, AHWD

Designated Managing Broker

Best Homes Fox Valley

200 Webster St

Montgomery, IL 60538

630-503-6555 Ext 101
Kriss Picture 012819 3 Thumb nail

Fox Valley home prices December 10th

Best Homes Fox Valley Home Prices Header

Fox Valley home prices December 10th.  Weather has been great so far for December.  Forecaster’s are saying we should be in the 40’s all week.

We will update you on what happened this last week on new listings, closed listings, contracts accepted, median prices, financing used, and 2022 by the month.   Provide you with some resources to checkout.

New listing this week are down.  82 this week compared to 105 the previous week.

Closed listings are also down.  132 this week compared to 177 the previous week.

Fox Valley home prices December 10th

Aurora-New 13 $149,900-$722,731

             Closed-14 $185,000-$626,002

Bolingbrook-New 5 $235,000-$399,000

                      Closed-16 $208,500-$836,659

Naperville-New 15 $409,000-$1,650,000

                   Closed-14 $432,000-$788,536

Plainfield-New 7 $350,000-$859,900

                  Closed-17 $222,000-$844,500

St Charles-New 4 $574,800-$1,275,000

                  Closed-11 $200,000-$1,125,000

Yorkville-New 3 $320,000-$354,990

                Closed-11 $275,000-$800,000

Take a look at the picture above to see the other communities that had activity this week.

Financing used, median prices, and 2,000 SF or more

Median list price this week $404,450, last week $392,495.

Closed median price this week $385,500, last week $380,000.

Stats 121022
Stats for week ending December 10th

Conventional financing was used to close on 86 homes this week at median price $404,500 with 37 days average market time, last week 122 homes at median price $407,500 with 45 days average market time.

Conv 121022
Conventional financing used to close for week ending December 10th

Cash was used to close on 25 homes this week at median price $451,900 with 30 days average market time, last week 22 homes with median price $352,250 with 34 days average market time.

Cash 121022
Cash used to close for week ending December 10th

FHA financing was used to close on 15 homes this week at median price $287,900 with 39 days average market time, last week 27 homes at median price $310,556 with 41 days average market time.

FHA 121022
FHA financing used to close for week ending December 10th

VA financing was used to close on 5 homes at median price $330,000 with 42 days average market time, last week also 5 homes at median price $438,000 with 23 days average market time.

VA 121022
VA financing used to close for week ending December 10th

2,000 square feet or more closed on 81 homes at median price $475,000 with 37 days average market time, last week 103 homes at median price $471,845 with 49 days average market time.  Minimum price this week $249,900, last week $240,000.

2000 SF or more 121022
2,000 SF or more homes closed for week ending December 10th

Contracts accepted this week

Contracts accepted this week are down.  94 this week compared to 112 the previous week.

Fox Valley home prices December 10th-Contracts accepted this week

Aurora-17                            Naperville-15

Plainfield-11

Look at the picture above for contracts accepted in other communities. 

No short sales were accepted this week from seller’s.

Seller’s accepted contracts that are contingent on the buyer closing on their current home.  2 with a kick-out clause of 72 hours and 3 with 48 hours.

Also, seller’s accepted contracts that are contingent on the buyer selling and closing on their current home. 1 with a kick-out clause of 72 hours and 1 with 24 hours.

Median price of homes that went under contract this week $355,745 with 114 days average market time, last week the median price $349,900 with 64 days average market time.

Contingent Stats 121022
Median price of contracts accepted for week ending December 10th

2022 by the month

Month                     New   Closed   Contracts accepted

January                   422        492            623

February                 523        520            724

March                     734         904           890

April                      1168         966          1334

May                       1101         893            806

June                       1295       1409           1234

July                         955         932            908

August                  1019        1134           1062

September              730         733            698

October                   699         612            646

November               574         764            624

December                 82          132              94

Totals                   9302        9491          9643

Check back with us every Saturday for the real estate market update for the Fox Valley area of Illinois.  At the end of each month we will also show you 2021 and 2020 so you can see how this year is doing.  This month will close out the year.  We are looking forward to 2023.

Resources

Click on everything that is bold and underlined to go to the site for the information.

Check with your loan officer for the interest rate you will be offered.  It depends on your credit score and other things that they will explain to you.

Look for our page on Facebook and you will be able to search for homes there anytime by clicking on the “shop now” button.

All data was downloaded this morning from our MLS, MRED, LLC.  The data changes throughout the day as agents upload information.

Contact us

Call us at 630-503-6555 with all your real estate questions.  Your goal is our goal.

Fox Valley home prices December 10th.  Have an awesome week!

Kristine Heiman, SFR, SRS, SRES, AHWD

Designated Managing Broker

Best Homes Fox Valley

200 Webster St

Montgomery, IL 60543

630-503-6555 Ext 101

Kriss Picture 012819 3 Thumb nail

Fox Valley home prices June 4

Fox Valley Home Prices April 23

Fox Valley home prices June 4.  I am a day late getting this posted.  All the information was downloaded yesterday though.  It has been busy.

New listings of single family homes were up.  279 this week compared to 243 the previous week.

Closed listings were also up.  306 this week compared to 252 the previous week.

Fox Valley home price June 4

Take a look at the communities with the most activity this week:

Aurora-New 43 $179,900-$700,000

             Closed-39 $157,500-$622,000

Batavia-New 12 $199,000-$676,108

              Closed-10 $244,600-$580,000

Bolingbrook-New 16 $259,900-$495,900

                      Closed-15 $237,500-$759,000

Geneva-New 12 $229,000-$921,500

              Closed-12 $288,000-$1,081,521

Naperville-New 54 $300,000-$1,895,000

                  Closed-67 $290,000-$1,600,000

Oswego-New 11 $264,000-$2,399,000

               Closed-25 $245,000-$631,000

Plainfield-New 32 $220,000-$1,550,000

                 Closed-39 $205,000-$680,000

St Charles-New 25 $235,000-$1,000,000

                  Closed-19 $210,000-$751,000

West Chicago-New 11 $250,000-$1,500,000

                        Closed-8 $293,000-$665,000

Yorkville-New 12 $320,000-$520,000

                Closed-7 $270,000-$550,000

Financing most used, median prices, and 2,000 SF or more

Median price this week $400,000, last week $399,999.

Closed median price this week $410,000, last week  also $410,000

Stats 060422
Stats for week ending June 4

Conventional financing was used to close on 251 homes this week at a median price $430,000 with 12 days average market time, last week 194 homes at median price of $427,550 with 30 days average market time.

Conv 060422
Conventional financing use to close for week ending June 4

Cash was used to close on 18 homes this week at a median price of $391,250 with 13 days average market time, last week 17 homes at a median price of $328,000 with 12 days average market time.

Cash 060422
Cash used to close for week ending June 4

FHA financing was used to close on 19  homes this week at a median price of $310,000 with 24 days average market time, last week 17 homes at median price of $328,000 with 12 days average market time.

FHA 060422
FHA financing used to close for week ending June 4

VA financing used to close on 15 homes at a  median price of $383,000 with 51 days average market time, last week 6 homes at median price of $390,000 with 6 days average market time.

VA 060422
VA financing used to close for week ending June 4

Buyer’s looking for homes that are at least 2,000 square feet or more closed on 193 homes at a median price of $480,000 with 16 days average market time, last week 157 homes at a median price of $500,000 with 29 days average market time.  The minimum price for a home that was at least 2,000 square feet or more was $155,000, last week $255,000.

2000 SF or more 060422
Homes that are at least 2,000 SF or more for week ending June 4

Contracts accepted this week

Contracts accepted this week were down.  218 this week compared to 275 the previous week.

Fox Valley home prices June 4-Contracts accepted this week

Look at the communities seller’s accepted the most contracts this week:

Aurora-41                           Bolingbrook-14

Naperville-42                    Plainfield-28

St Charles-14                     Yorkville-10

No short sales went under contract this week.

Seller’s accepted contracts that are contingent on the buyer closing on their current home.  1 with a kick-out clause of 72 hours, 4 with 48 hours, and 2 with 24 hours.

Also, seller’s accepted contracts that are contingent on the buyer selling and closing on their current home.  2 with a kick-out clause of 48 hours and 1 that we don’t know the time frame.

The median price of homes under contract this week is $399,450 with 20 days average market time, last week the median price was $399,900 with 17 days average market time.

Contingent Stats 060422

2022 by the month

Month                 New   Closed   Contracts accepted

January               422        492             623

February             523        520             724

March                 734        904             890

April                  1168        966            1334

May                   1101        893             806

June                    279        306             218

Totals               4227      4081           4595

More new listings than closed is a good sign that things are changing slightly.  Prices are still increasing and inventory is low, but we hope June continues to increase the amount of listings of homes for sale.

Check back with us every Saturday for the real estate market update.  We are late this week but try not to be.  At the end of each month we will take a look back at 2021 and 2020 so you can see how this year is going.

Resources

Everything that is bold and underlined you can click on and it will take you to the site for the information.  If there is other information you are looking for not here please let us know and we will point you in the right direction.

Check with your loan officer to see what interest rate you will be offered.  It depends on your credit score.  If you need to bring up your score they can help you with that.

Request a home valuation if you are thinking about selling your home.  Give is a little information about your home and what has been updated.  Let us know the best way to get in touch with you and we will give you an estimate of what it is worth in today’s market.  You will also get an estimate of expenses to sell.  This will be updated when an offer comes in and we know all the details.

If you are wanting to buy a home you need to get in touch with a loan officer and get them all your financial information and have them put you through underwriting so you are approved for a loan.  It is not enough to just get pre-approved right now.  You will be up against multiple offers so you want to be in the best position to win.

You can sign-up for email alerts so you don’t miss out on anything coming on the market.

Contact us

Call us at 630-503-6555 with all your real estate questions.  Your goal is our goal.  We will do everything we can to help you reach your goal.

If you need recommendations for loan officers, real estate attorney, or home inspector we can give you a few to contact and choose who you want to work with.

All data provided is from our MLS.  MRED, LLC.

Fox Valley home prices June 4.  Have an awesome week!

Kristine Heiman, SFR, SRS, AHWD

Designated Managing Broker

Best Homes Fox Valley

200 Webster St

Montgomery, IL 60538

630-503-6555 ext 101
Search for a home today!

Kriss New profile for FB 123121