Fox Valley home prices January 7th

Best Homes Fox Valley Home Prices Header

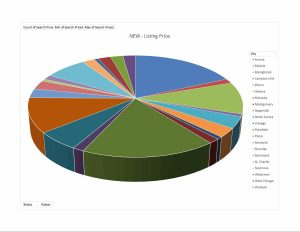
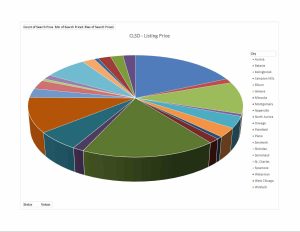
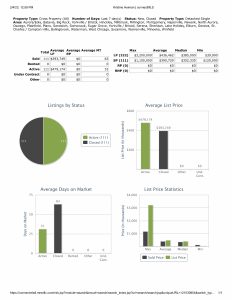
Fox Valley  home prices January 7th.  First week of the new year.

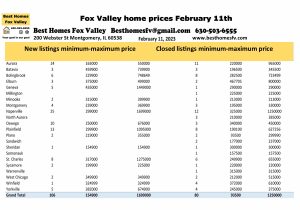
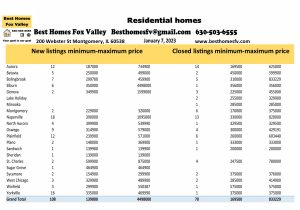
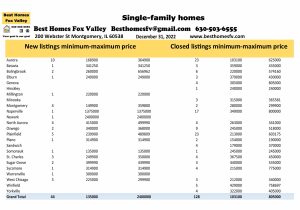
New listings this week were more than doubled.  108 this week compared to 44 the previous week.

Closed listings were down.  70 this week compared to 128 the previous week.

Fox Valley home prices January 7th

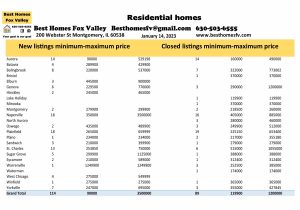
Aurora-New 12 $187,000-$734,900

             Closed-14 $169,500-$625,000

Naperville-New 18 $390,000-$1,095,000

                   Closed-13 $330,000-$820,000

Plainfield-New 12 $239,900-$571,000

                 Closed-6 $260,000-$603,440

Yorkville-New 16 $335,000-$469,990

                Closed-1 $3

75,000

Click on the photo above to see other communities that had activity this week.  We are just highlighting the ones with the most activity.

Financing used, median prices, and 2,000 SF or more

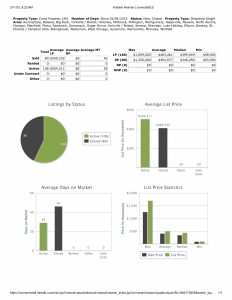
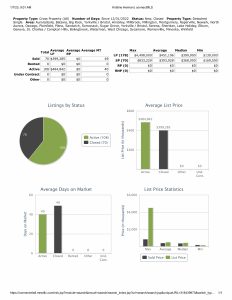
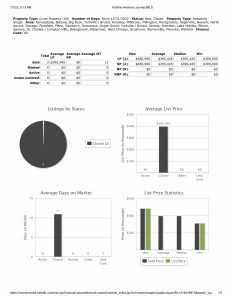
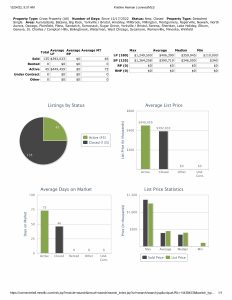
Median list price this week $399,900, last week $350,000.

Closed median price this week $368,000, last week $368,750.

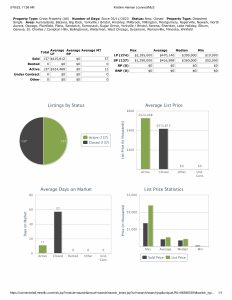
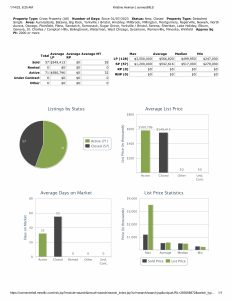
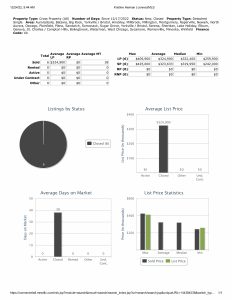
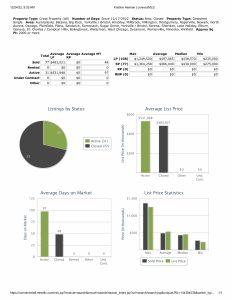
Stats 010723
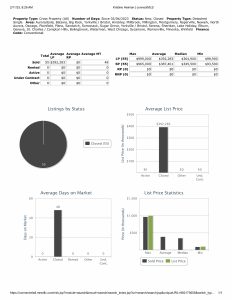
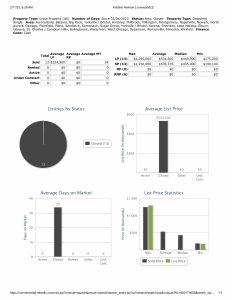
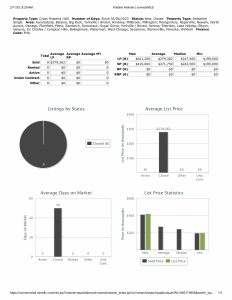
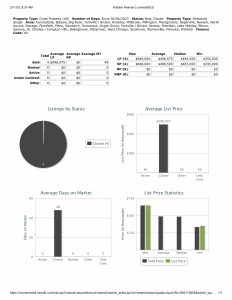
Stats for week ending January 7th

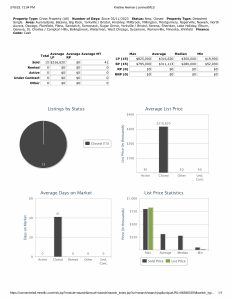
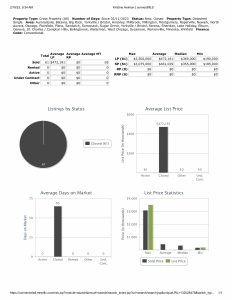
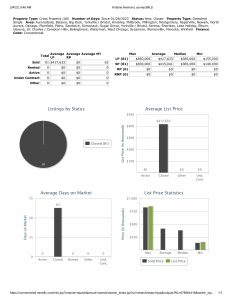
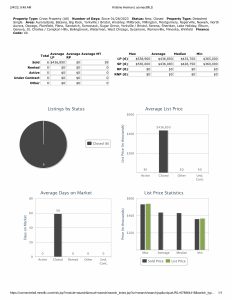
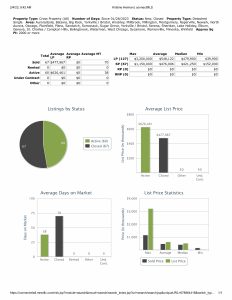
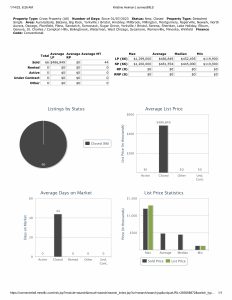
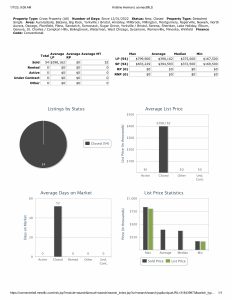
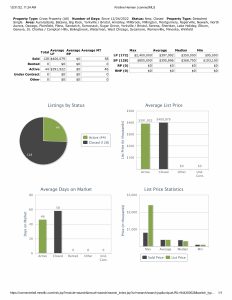
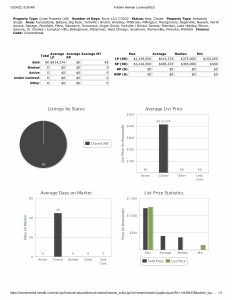
Conventional financing was used to close on 54 homes this week at median price $372,500 with 52 days average market time, last week 85 homes at median price $379,990 with 58 days average market time.

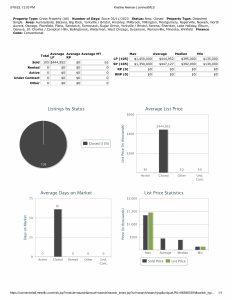
Conv 010723
Conventional financing used to close for week ending January 7th

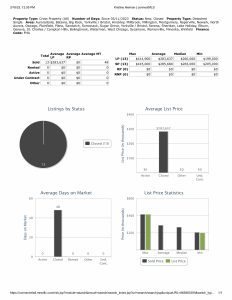
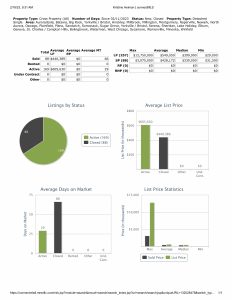
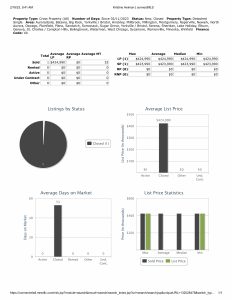
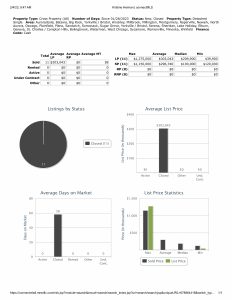
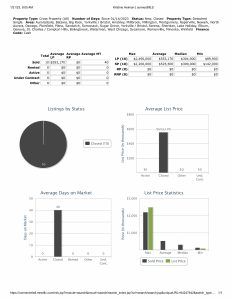
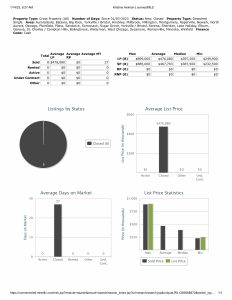
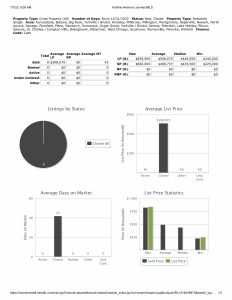
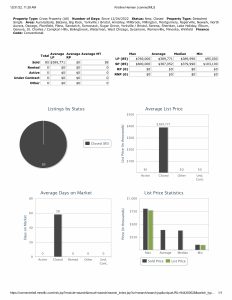
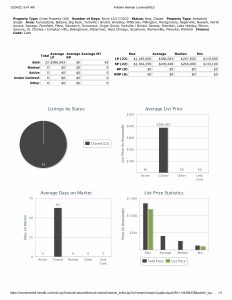
Cash was used to close on 8 homes this week at median price $435,500 with 42 days average market time, last week 21 homes at median price $467,500 with 65 days average market time.

Cash 010723
Cash used to close for week ending January 7th

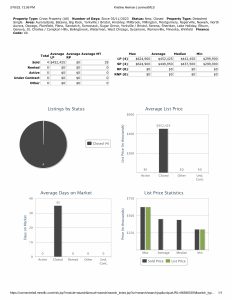
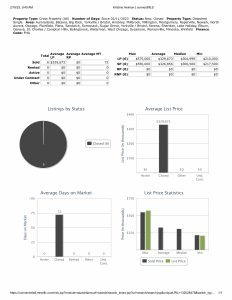
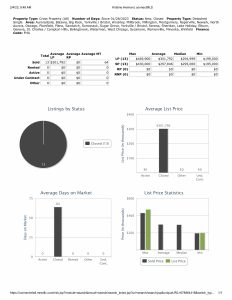
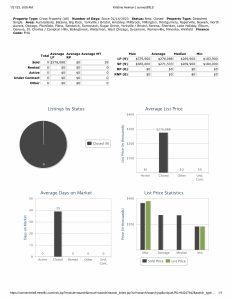
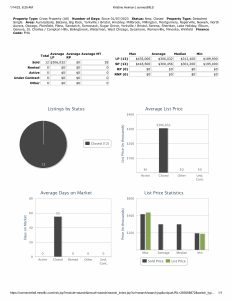
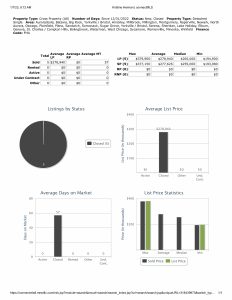
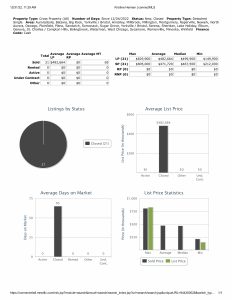
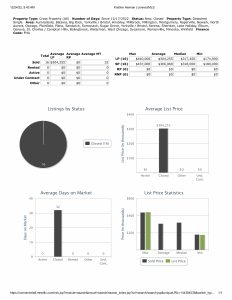
FHA financing was used to close on 5 homes this week at median price $255,000 with 57 days average market time, last week 15 homes at median price $311,000 with 24 days average market time.

FHA 010723
FHA financing used to close for week ending January 7th

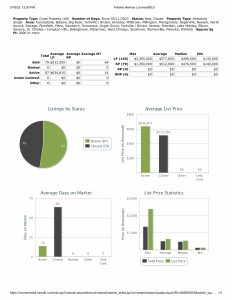
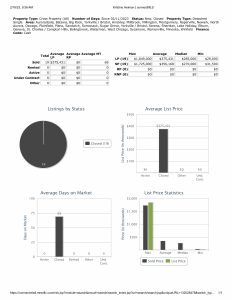
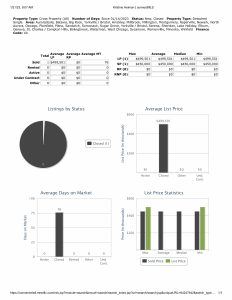
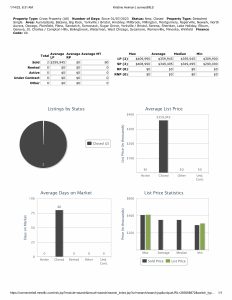
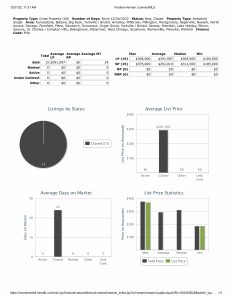
VA financing was used to close on 2 homes at median price $395,445 with 11 days average market time, last week 6 homes at median price $467,000 with 57 days average market time.

VA 010723
VA financing used to close for week ending January 7th

2,000 square feet or more closed on 38 homes this week at median price $447,500 with 57 days average market time, last week 68 homes at median price $447,170 with 73 days average market time.  Minimum price this week $258,500, last week $240,000.

Residential homes that went under contract this week

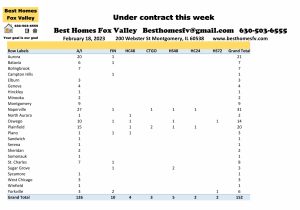
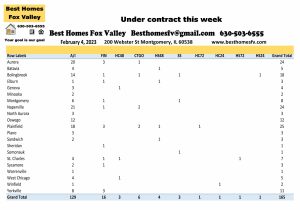
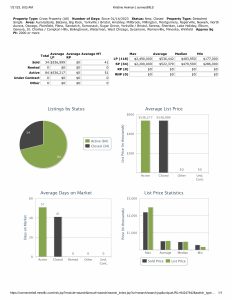
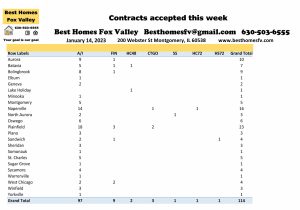
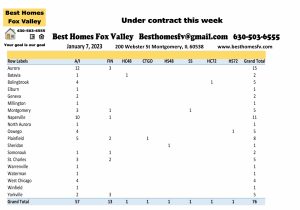
Residential homes under contract this week were up.  76 this week compared to 51 the previous week.

Fox Valley home prices January 7th-under contract this week

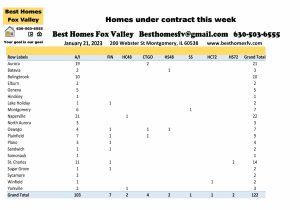
Aurora-15                                Naperville-11

Click on the photo to see other communities with activity this week.

1 short sale was accepted this week by a seller.  It was in Montgomery.  Now it will be submitted to the lender to see if they will also accept.

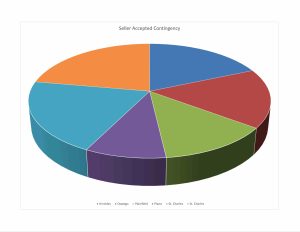
Seller’s accepted contracts that are contingent on the buyer closing on their current home.  1 with a kick-out clause of 72 hours and 1 with 48 hours.

Also, seller’s accepted contracts that are contingent on the buyer selling and closing on their current home.  1 with a kick-out clause of 72 hours and 1 with 48 hours.

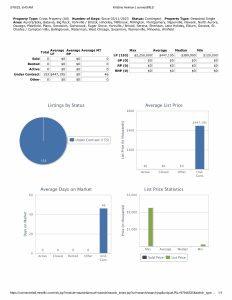
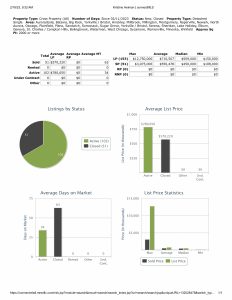
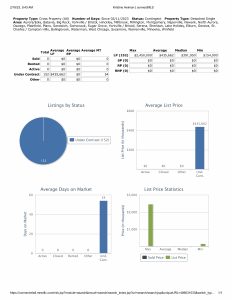
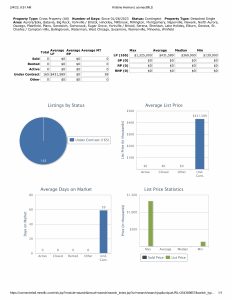
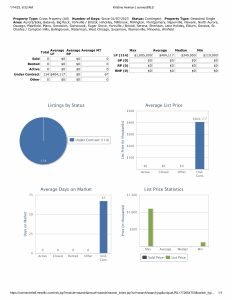
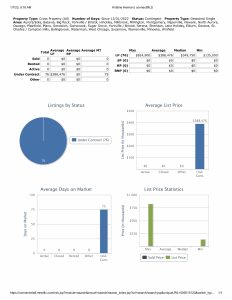
Median price under contract this week $349,750 with 75 days average market time, last week the median price $385,000 with 62 days average market time.

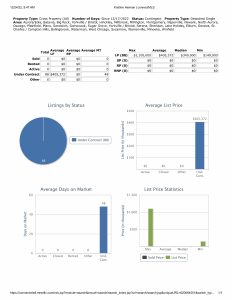
Contingent Stats 010723
Median price of homes under contract for week ending January 7th

2023 by the month

Month                   New   Closed   Contract accepted

January                  108       70              76

Check back with us every Saturday for the real estate market update for the Fox Valley area of Illinois.  At the end of each month we will also take a look back at 2022, and 2021 so you can compare.

Resources

Click on everything that is bold and underlined to take you to the site for the information.

Check with your loan officer to see what interest rate you will be offered.  It depends on the credit score and other things that your loan officer will explain to you.

All data provided to day is from our MLS, MRED, LLC.  The data changes continuously throughout the day as agent upload their information.

Contact us

Call us at 630-503-6555 with all your real estate questions.  Your goal is our goal.

Fox Valley home prices January 7th.  Have an awesome week!

Kristine Heiman, SFR, SRS, SRES, AHWD

Designated Managing Broker

Best Homes Fox Valley

200 Webster St

Montgomery, IL 60538

630-503-6555 Ext 101

Kriss Picture 012819 3 Thumb nail

Fox Valley home prices December 31st

Best Homes Fox Valley Home Prices Header

Fox Valley home prices December 31st.  Happy New Year’s Eve!  If a home is in your plans for 2023, we would love to help you.

The holidays have really slowed things down.  We hope it will start picking up soon in the new year.

We will show you how many new listings, closed, under contract, median prices, financing used, and 2022 by the month and also show you activity in 2021 and 2020 so you can see how this year compared.

New listings this week were down.  44 this week compared to 45 the previous week.  Consistent, but way down.

Closed listings this week were also down.  128 this week compared to 135 the previous week.

Fox Valley home prices December 31st

Aurora-New 10 $168,900-$364,900

             Closed-23 $103,100-$625,000

Naperville-New 1 $1,375,000

                   Closed-17 $349,000-$800,000

Plainfield-New 5 $239,900-$489,809

                 Closed-23 $213,000-$603,175

Click on the photo above to see other communities with activity this week.

Financing used, median prices, and 2,000 SF or more

Median list price this week $350,000, last week $359,945.

Closed median price this week $368,750, last week $346,000.

Stats 123122
Stats for week ending December 31st

Conventional financing was used to close on 85 homes this week at median price $379,990 with 58 days average market time, last week 90 homes at median price $365,000 with 45 days average market time.

Conv 123122
Conventional financing used to close for week ending December 31st

Cash was used to close on 21 homes this week at median price $467,500 with 65 days average market time, last week 22 homes at median price $265,000 with 63 days average market time.

Cash 123122
Cash used to close for week ending December 31st

FHA financing was used to close on 15 homes this week at median price $311,000 with 24 average market time, last week 16 homes at median price $318,000 with 32 days average market time.

FHA 123122
FHA financing used to close for week ending December 31st

VA financing was used to close on 6 homes at median price $467,000 with 57 days average market time, last week also 6 homes at median price $319,950 with 38 days average market time.

VA 123122
VA financing used to close for week ending December 31st

2,000 square feet or more closed on 68 homes at median price $447,170 with 73 days average market time, last week 77 homes at median price $430,000 with 48 days average market time.  Minimum price this week $240,000, last week $275,000.

2000 SF or more 123122
2,000 SF or more closed for week ending December 31st

Contracts accepted this week

Contracts accepted by seller’s this week are down.  51 this week compared to 88 the previous week.

Plainfield had 7 and Aurora, Batavia, and Bolingbrook had 6.

No short sales were accepted this week.

No contracts were accepted with contingencies on a home close or a home sale and closing this week.

Median price of homes that went under contract this week $385,000 with 62 average market time, last week the median price $349,000 with 48 days average market time.

Contingent Stats 123122
Median price of homes under contract for week ending December 31st

2022 by the month and a look back at 2021 and 2020

2022

Month                      New   Closed   Contracts accepted

January                     422       492              623

February                   523       520              724

March                       734       904              890

April                         1168      966             1334

May                           1101      893              806

June                         1295    1409             1234

July                           955      932              908

August                     1019      1134            1062

September               730        733             698

October                    699        612             646

November                 574        764             624

December                 257        524             322

Totals              9477    9883       9871

2021

January                     543        649            829

February                   561         604            778

March                       993        1099          1455

April                        1006         926          1387

May                         1088        1288          1289

June                        1450        1686          1671

July                          1118         1182          1210

August                     1109         1203          1170

September              1083          1411          1251

October                    715           973           930

November                 557          854            931

December                 349         1044           652

Totals            10572    12919     13553

2020

January                    1105        566            858

February                  1267        529          1024

March                       1186        707          1079

April                          648        786           775

May                          1352       1010          1444

June                         1232        908          1534

July                          1417       1453          1852

August                     1037       1335          1436

September               1176       1503          1503

October                    843        1116           1159

November                 567         985            699

December                 513          971            783

Totals            12343    11869     14146

From 2020 to 2022 look at the difference in the amount of new listings.

Resources

Click on everything that is bold and underlined to take you to the site for the information.

Check with your loan officer to see what interest rate you will be offered.  It depends on your credit score and other things that they will explain to you.

If you are thinking about buying a home this year you will want to get the process started to get your loan approved so you know that no issues will come up at the last minute.  You will be in a better position to get your offer excepted.  This is not just talking to a loan officer over the phone.  This is getting all your information to them.

All data used was downloaded yesterday from our MLS, MRED, LLC.  I didn’t get the chance to finish this until today.

Contact us

Call us at 630-503-6555 with all your real estate questions.  Your goal is our goal.

Fox Valley home prices December 31st.  Happy New Year!

Kristine Heiman, SFR, SRS, SRES, AHWD

Designated Managing Broker

Best Homes Fox Valley

200 Webster St

Montgomery, IL 60538

630-503-6555 Ext 101

Kriss Picture 012819 3 Thumb nail

Fox Valley home prices December 24th

Best Homes Fox Valley Home Prices Header

Fox Valley home prices December 24th.  The last 2 days were just too busy to post this week’s blog post.  I downloaded all the information on Saturday and just now have the time time to put it all together.

We will let you know about new listings, closed listings, contracts accepted, median prices, financing used, and 2022 by the month for this last week.   Some people post graphs but I like to break it down to each community that had activity and what happened there.

New listings this week are way down.  45 this week compared to 86 the previous week.  After we get past the holidays things should pick up.

Closed listings are up. 135 this week compared to 129 the previous week.

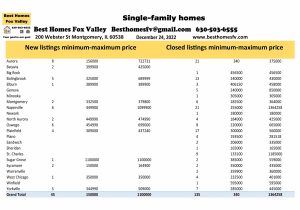
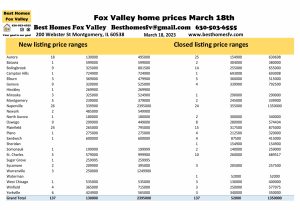
Fox Valley home prices December 24th

Aurora-New 8 $156,000-$722,731

             Closed-21 $340(must be a mistake)-$375,000

Bolingbrook-New 5 $325,000-$689,999

                      Closed-13 $240,000-$430,000

Naperville-New 6 $449,900-$1,099,900

                   Closed-21 $255,000-$1,364,258

Plainfield-New 4 $309,000-$437,240

                  Closed-17 $300,000-$560,000

Other communities had activity.  Please look at the photo above to see activity in other communities.

Financing used, median prices, and 2,000 SF or more

Median list price this week $359,945, last week $385,000

Closed median price this week $346,000, last week $357,000.

Stats 1222422
Stats for week ending December 24th

Conventional financing was used to close on 90 homes this week at median price $365,000 with 45 days average market time, last week 91 homes at median price $365,000 with 38 days average market time.

Conv 122422
Conventional financing used to close for week ending December 24th

Cash was used to close on 22 homes at median price $265,000 with 63 days average market time, last week 21 homes at median price $385,000 with 45 days average market time.

Cash 122422
Cash used to close for week ending December 24th

FHA financing was used to close on 16 homes at median price $318,000 with 32 days average market time, last week 10 homes at median price $326,250 with 41 days average market time.

FHA 122422
FHA financing used to close for week ending December 24th

VA financing was used to close 6 homes this week at median price $319,950 with 38 days average market time, last week 3 homes at median price $360,000 with 51 days average market time.

VA 122422
VA financing used to close for week ending December 24th

2,000 Square feet or more closed on 77 homes this week at median price $430,000 with 48 days average market time, last week 75 homes at median price $450,000 with 45 days average market time.  Minimum price this week $275,000, last week $50,000.

2000 SF or more 122422
2,000 SF or more homes closed for week ending December 24th

Conventional financing is still the most desired financing and the majority of homes closed are 2,000 Sf or more.

Contracts accepted this week

Contracts accepted this week are consistent.  88 this week compared to 89 the previous week.

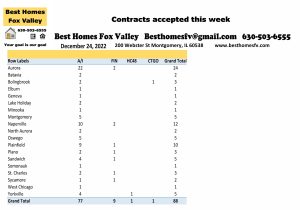
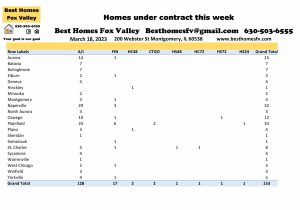
Fox Valley home prices December 24th-Contracts accepted this week

Aurora-24                           Naperville-12

Plainfield-10

Other communities had activity.  To see those communities click on the photo above.

No short sales were accepted this week.

A seller accepted a contract that is contingent on the buyer closing on their current home.  1 with a kick-out clause of 48 hours.

Median price of homes that went under contract this week $349,000 with 48 days average market time, last week $379,900 with 56 days average market time.

Contingent stats 122422
Median price of homes that went under contract for week ending December 24th

2022 by the month

Month                      New   Closed   Contracts accepted

January                     422       492             623

February                   523       520             724

March                        734      904             890

April                         1168      966            1334

May                          1101      893             806

June                          1295    1409            1234

July                            955      932             908

August                     1019     1134            1062

September                730       733             698

October                     699       612             646

November                 574       764             624

December                  213       396             271

Totals                      9433     9755          9820

Next week is the last week of the month and the last week of the year.  We will show you 2021 and 2020 also so you can see how this year went compared to the previous 2 years.

Check back with us every Saturday for the real estate market update for the Fox Valley area of Illinois.

Resources

Click on everything that is bold and underlined to go to the site for the information.

Check with your loan officer for the interest rate you will be offered.  It depends on your credit score and other things the loan officer will explain to you.

You can also connect with us on Facebook and search for homes there anytime by clicking on the “shop now” button.

All data provided is from our MLS, MRED, LLC.  Data changes continuously throughout the day as agents upload their information.

Contact us

Call us at 630-503-6555 for all your real estate questions.  Your goal is our goal.

Fox Valley home prices December 24th.  Have an awesome week and a happy and prosperous New Year!

Kristine Heiman, SFR, SRS, SRES, AHWD

Designated Managing Broker

Best Homes Fox Valley

200 Webster St

Montgomery, IL 60538

630-503-6555 Ext 101
Kriss Picture 012819 3 Thumb nail

Fox Valley home prices December 17th

Best Homes Fox Valley Home Prices Header

Fox Valley home prices December 17th.   Things have really slowed down the closer we get to the holidays.

We will let you know how many new listings, closed listings, contracts accepted, 2022 by the month, median prices, and financing used to close.

New listings this week were slow but consistent.  86 this week compared to 82 the previous week.

Closed listings were consistent also.  129 this week compared to 132 the previous week.

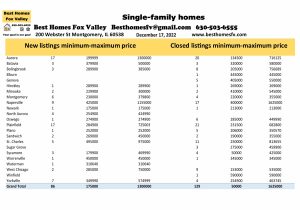
Fox Valley home prices December 17th

Aurora-New 17 $199,999-$1,300,000

             Closed-20 $134,500-$716,125

Naperville-New 9 $425,000-$1,155,000

                   Closed-17 $400,000-$1,625,000

Plainfield-New 17 $284,900-$725,003

                 Closed-21 $231,500-$682,800

St Charles-New 5 $495,000-$975,000

                  Closed-11 $250,000-$813,655

Other communities had activity this week.  Look at the photo above to see.  We just highlight the ones with the most activity.

Financing used, median prices and 2,000 SF or more

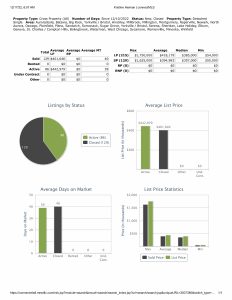
Median list price this week $385,000, last week $404,450.

Closed median price this week $357,000, last week $385,500.

Stats 121722
Stats for week ending December 17th

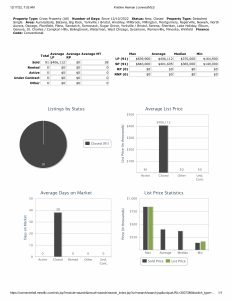
Conventional financing was used to close on 91 homes this week ate median price $365,000 with 38 days average market time, last week 86 homes at median price $404,500 with 37 days average market time.

Conv 121722
Conventional financing used to close for week ending December 17th

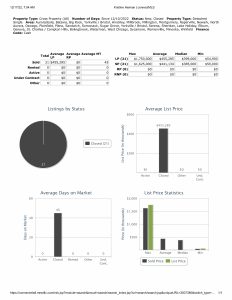
Cash was used to close on 21 homes this week at median price $385,000 with 45 days average market time, last week 25 homes at median price $451,900 with 30 days average market time.

Cash 121722
Cash used to close for week ending December 17th

FHA financing was used to close on 10 homes at median price $326,250 with 41 days average market time, last week 15 homes at median price $287,900 with 39 days average market time.

FHA 121722
FHA financing used to close for week ending December 17th

VA financing was used to close on 3 homes at median price $360,000 with 51 days average market time, last week 5 homes at median price $330,000 with 42 days average market time.

VA 121722
VA financing used to close for week ending December 17th

2,000 SF or more closed on 75 homes at median price $450,000 with 45 days average market time, last week 81 homes at median price $475,000 with 37 days average market time.  Minimum price this week $50,000, last week $249,900.

2000 SF or more 121722
2,000 SF or more closed for week ending December 17th

Conventional financing is still the most used financing to close.

Contracts accepted this week

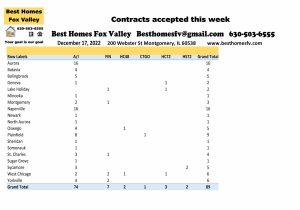
Contracts accepted this week were consistent.  89 this week compared to 94 the previous week.

Fox Valley home prices December 17th-Contracts accepted this week

Aurora-16                         Naperville-16

Look at the photo above for the other communities seller’s accepted contracts.

No short sales were accepted this week by seller’s.

Seller’s accepted contracts that are contingent on the buyer closing on their current home.  3 with a kick-out clause of 72 hours and 2 with 48 hours.

Also, seller’s accepted contracts that are contingent on the buyer selling and closing on their current home.  2 with a kick-out clause of 72 hours.

Median price of homes that went under contract this week $379,900 with 56 days average market time, last week $355,745 with 114 days average market time.

Contingent Stats 121722
Contract accepted stats for week ending December 17th

2022 by the month

Month                   New   Closed   Contracts accepted

January                  422       492             623

February                523       520             724

March                    734        904            890

April                     1168        966           1334

May                      1101        893            806

June                      1295      1409           1234

July                        955        932            908

August                 1019       1134           1062

September            730         733            698

October                 699         612            646

November             574         764            624

December              168         261            183

Totals                  9388      9620          9732

Couple more weeks left for 2022.  New Years Eve we will show you 2021 and 2020 so you can compare the 3 years.

Check back with us every Saturday for the real estate market update in the Fox Valley area of Illinois.

Resources

Click on everything that is bold and underlined to go to the site for the information.

Check with your loan officer to see what interest rates you will be offered.  It depends on your credit score and other things the loan officer will explain to you.

If there is other information that you are looking for and can’t find it, let us know, and we will point you in the right direction.

We invite you to connect with us onFacebook.  If you click on the “shop now” button you can also search for homes there anytime you like.

All data provided is from our MLS, MRED, LLC.  The data changes continuously throughout the day as agents upload their information.

Contact us

Call us at 630-503-6555 with all your real estate questions.  Your goal is our goal.

Fox Valley home prices December 17th.  Have an awesome week!

Kristine Heiman, SFR, SRS, SRES, AHWD

Designated Managing Broker

Best Homes Fox Valley

200 Webster St

Montgomery, IL 60538

630-503-6555 Ext 101
Kriss Picture 012819 3 Thumb nail

Fox Valley home prices December 10th

Best Homes Fox Valley Home Prices Header

Fox Valley home prices December 10th.  Weather has been great so far for December.  Forecaster’s are saying we should be in the 40’s all week.

We will update you on what happened this last week on new listings, closed listings, contracts accepted, median prices, financing used, and 2022 by the month.   Provide you with some resources to checkout.

New listing this week are down.  82 this week compared to 105 the previous week.

Closed listings are also down.  132 this week compared to 177 the previous week.

Fox Valley home prices December 10th

Aurora-New 13 $149,900-$722,731

             Closed-14 $185,000-$626,002

Bolingbrook-New 5 $235,000-$399,000

                      Closed-16 $208,500-$836,659

Naperville-New 15 $409,000-$1,650,000

                   Closed-14 $432,000-$788,536

Plainfield-New 7 $350,000-$859,900

                  Closed-17 $222,000-$844,500

St Charles-New 4 $574,800-$1,275,000

                  Closed-11 $200,000-$1,125,000

Yorkville-New 3 $320,000-$354,990

                Closed-11 $275,000-$800,000

Take a look at the picture above to see the other communities that had activity this week.

Financing used, median prices, and 2,000 SF or more

Median list price this week $404,450, last week $392,495.

Closed median price this week $385,500, last week $380,000.

Stats 121022
Stats for week ending December 10th

Conventional financing was used to close on 86 homes this week at median price $404,500 with 37 days average market time, last week 122 homes at median price $407,500 with 45 days average market time.

Conv 121022
Conventional financing used to close for week ending December 10th

Cash was used to close on 25 homes this week at median price $451,900 with 30 days average market time, last week 22 homes with median price $352,250 with 34 days average market time.

Cash 121022
Cash used to close for week ending December 10th

FHA financing was used to close on 15 homes this week at median price $287,900 with 39 days average market time, last week 27 homes at median price $310,556 with 41 days average market time.

FHA 121022
FHA financing used to close for week ending December 10th

VA financing was used to close on 5 homes at median price $330,000 with 42 days average market time, last week also 5 homes at median price $438,000 with 23 days average market time.

VA 121022
VA financing used to close for week ending December 10th

2,000 square feet or more closed on 81 homes at median price $475,000 with 37 days average market time, last week 103 homes at median price $471,845 with 49 days average market time.  Minimum price this week $249,900, last week $240,000.

2000 SF or more 121022
2,000 SF or more homes closed for week ending December 10th

Contracts accepted this week

Contracts accepted this week are down.  94 this week compared to 112 the previous week.

Fox Valley home prices December 10th-Contracts accepted this week

Aurora-17                            Naperville-15

Plainfield-11

Look at the picture above for contracts accepted in other communities. 

No short sales were accepted this week from seller’s.

Seller’s accepted contracts that are contingent on the buyer closing on their current home.  2 with a kick-out clause of 72 hours and 3 with 48 hours.

Also, seller’s accepted contracts that are contingent on the buyer selling and closing on their current home. 1 with a kick-out clause of 72 hours and 1 with 24 hours.

Median price of homes that went under contract this week $355,745 with 114 days average market time, last week the median price $349,900 with 64 days average market time.

Contingent Stats 121022
Median price of contracts accepted for week ending December 10th

2022 by the month

Month                     New   Closed   Contracts accepted

January                   422        492            623

February                 523        520            724

March                     734         904           890

April                      1168         966          1334

May                       1101         893            806

June                       1295       1409           1234

July                         955         932            908

August                  1019        1134           1062

September              730         733            698

October                   699         612            646

November               574         764            624

December                 82          132              94

Totals                   9302        9491          9643

Check back with us every Saturday for the real estate market update for the Fox Valley area of Illinois.  At the end of each month we will also show you 2021 and 2020 so you can see how this year is doing.  This month will close out the year.  We are looking forward to 2023.

Resources

Click on everything that is bold and underlined to go to the site for the information.

Check with your loan officer for the interest rate you will be offered.  It depends on your credit score and other things that they will explain to you.

Look for our page on Facebook and you will be able to search for homes there anytime by clicking on the “shop now” button.

All data was downloaded this morning from our MLS, MRED, LLC.  The data changes throughout the day as agents upload information.

Contact us

Call us at 630-503-6555 with all your real estate questions.  Your goal is our goal.

Fox Valley home prices December 10th.  Have an awesome week!

Kristine Heiman, SFR, SRS, SRES, AHWD

Designated Managing Broker

Best Homes Fox Valley

200 Webster St

Montgomery, IL 60543

630-503-6555 Ext 101

Kriss Picture 012819 3 Thumb nail

Fox Valley home prices December 3rd

Best Homes Fox Valley Home Prices Header

Fox Valley home prices December 3rd.  It was a little busy yesterday so I didn’t get this posted.

We will show you the communities with the most activity listing prices, closed prices, contracts accepted this week, median prices, financing used, and 2022 by the month and a look back at 2021 and 2020 so you can see how this year is going.  Resources for you to check out.

New listings this week were up.  105 this week compared to 80 the previous week.

Closed listings were also up.  177 this week compared to 112 the previous week.

Aurora-New 17 $89,900-$795,000

             Closed-24 $205,000-$840,000

Bolingbrook-New 9 $214,900-$781,170

                      Closed-12 $200,000-$711,545

Geneva-New 2 $389,900-$825,000

              Closed-11 $195,000-$950,000

Naperville-New 18 $440,000-$1,995,000

                   Closed-24 $226,000-$1,465,000

Oswego-New 6 $379,900-$525,000

               Closed-11 $240,000-$659,500

Plainfield-New 16 $199,000-$1,199,900

                 Closed-23 $270,000-$616,000

St Charles-New 4 $239,000-$700,000

                  Closed-13 $242,000-$1,700,001

Yorkville-New 1 $525,000

                Closed-11 $230,000-$702,600

Click on the photo above to see the communities that also had activity.

Financing used, median prices, and 2,000 SF or more

Median list price this week $392,495, last week $364,950.

Closed median price this week $380,000, last week $382,495.

Stats 120322
Stats for week ending December 3rd

Conventional financing was used to close on 122 homes this week at median price $407,500 with 45 days average market time, last week 79 homes at median price $415,000 with 35 days average market time.

Conv 120322
Conventional financing used to close for week ending December 3rd

Cash was used to close on 22 homes this week at median price $352,250 with 34 days average market time, last week 9 homes at median price $475,000 with 26 days average market time.

Cash 120322
Cash used to close for week ending December 3rd

FHA financing was used to close on 27 homes this week at median price $310,556 with 41 days average market time, last week 19 homes at median price $300,000 with 47 days average market time.

FHA 120322
FHA financing was used to close for week ending December 3rd

VA financing was used to close on 5 homes this week at median price $438,000 with 23 average market time, last week also 5 homes at median price $340,000 with 34 days average market time.

VA 120322
VA financing used to close for week ending December 3rd

2,000 square feet or more closed on 103 homes this week at median price $471,845 with 49 days average market time, last week 69 homes at median price $460,000 with 34 days average market time.  Minimum price this week $240,000, last week $267,000.

2000 SF or ore 120322
2,000 SF or more closed for week ending December 3rd

Contracts accepted this week

Contracts accepted this week were down.  112 this week compared to 132 the previous week.

Fox Valley home prices December 3rd-Contracts accepted this week

Aurora-28                        Naperville-12

Plainfield-18

Take a look at the photo above for the other communities with activity.

No short sales were accepted by seller’s this week.

Seller’s accepted contracts that are contingent on the buyer closing on their current home.  1 each with a kick-out clause of 72 hours, 48 hours, and 24 hours.

Also, seller’s accepted contracts that are contingent on the buyer selling and closing on their current home.  1 with a kick-out clause of 72 hours, 3 with 48 hours, and 1 with 24 hours.

Median price that went under contract this week $349,900 with 64 days average market time, last week $375,000 with 54 days average market time.

Contingent Stats 120322
Homes that went under contract this week

2022 by the month and a look back at 2021 and 2020

2022

Month                 New   Closed    Contracts accepted

January                422       492                623

February              523       520                724

March                  734        904               890

April                   1168        966              1334

May                    1101        893                806

June                    1295      1409               1234

July                      955        932                908

August                1019      1134               1062

September           730        733                698

October                699        612                646

November            574        764                624

Totals                 9220     9359              9549

2021

January                543       649                829

February              561        604                778

March                  993      1099               1455

April                  1006        926               1387

May                   1088      1288               1289

June                   1450      1686                1671

July                     1118       1182                1210

August               1109      1203                1170

September         1083       1411                1251

October               715         973                 930

November           557        854                  931

Totals              10223      11875              12901

2020

January              1105       566                  858

February            1267       529                 1024

March                 1186       707                  1079

April                    648       786                   775

May                   1352      1010                 1444

June                   1232       908                  1534

July                    1417      1453                  1852

August              1037      1335                  1436

September         1176      1503                  1503

October              843       1116                   1159

November          567        985                    699

Totals             11830     10898                 13363

There were 2610 more new listings in 2020 than this year. 

For November it is pretty consistent all 3 years.

Check back with us every Saturday for the real estate market update in the Fox Valley area of Illinois.

Resources

Click on everything that is bold and underlined so it will take you to the site for the information.

Check with your loan officer to see the interest rate you will be offered.  It depends on your credit score and other things that they will explain to you.

You can connect with us on Facebook and search for homes there as well.  Click on the “shop now” button and search anywhere in Illinois.

All data provided was downloaded yesterday morning from our MLS, MRED, LLC.  It changes continuously throughout the day.

Contact us

Call us at 630-503-6555 with all your real estate questions.  Your goal is our goal. 

Fox Valley home prices December 3rd.  Have an awesome week!

Kristine Heiman, SFR, SRS, SRES, AHWD

Designated Managing Broker

Best Homes Fox Valley

200 Webster St

Montgomery, IL 60538

630-503-6555 Ext 101

Kriss Picture 012819 3 Thumb nail

Fox Valley home prices October 29th

Best Homes Fox Valley Home Prices Header

Fox Valley home prices October 29th.  It is the end of the month so we will show you 2022, 2021, and 2020 so you can see how this year is going.  We will also show you the communities with the most activity this week, median prices, financing used to close, and contracts accepted this week.

New Listings this week were down.  152 this week compared to 174 the previous week.

Closed listings this week were also down.  144 this week compared to 154 the previous week.

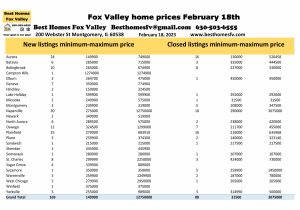
Fox Valley home prices October 29th  

Aurora-New 24 $140,000-$630,269

             Closed-20 $185,000-$800,000

Bolingbrook-New 9 $239,900-$649,900

                      Closed-11 $185,000-$481,000

Montgomery-New 5 $200,000-$344,900

                       Closed-10 $219,900-$415,000

Naperville-New 24 $379,000-$1,250,000

                   Closed-22 $305,250-$1,290,000

Plainfield-New 24 $245,000-$584,740

                 Closed-22 $206,000-$615,740

St Charles-New 10 $234,900-$1,325,000

                  Closed-13 $298,900-$815,000

Yorkville-New 11 $278,000-$535,000

                Closed-2 $260,000-$396,125

Financing used to close, median prices and 2,000 SF or more

Median list price this week $389,999, last week $375,950

Closed median price this week $375,000, last week $338,000.

Stats 102922
Stats for week ending October 29th

Conventional financing was used to close on 89 homes this week at median price $400,000 with 37 days average market time, last week 107 homes at median price $350,000 with 33 days average market time.

Conv 102922
Conventional financing used to close for week ending October 29th

Cash was used to close on 24 homes this week at median price $390,000 with 24 days average market time, last week also 24 homes at median price $370,000 with 35 days average market time.

Cash 102922
Cash used to close for week ending October 29th

FHA financing was used to close on 19 homes at median price $298,900 with 38 days average market time, last week 16 homes at median price $272,290 with 24 days average market time.

FHA 102922
FHA financing used to close for week ending October 29th

VA financing was used to close on 9 homes this week at median price $375,000 with 15 days average market time, last week 8 homes at median price $287,000 with 23 days average market time.

VA 102922
VA financing used to close for week ending October 29th

2,000 Square feet or more closed on 88 homes at median price $464,994 with 35 days average market time, last week 75 homes at median price $435,000 with 34 days average market time.  Minimum price this week $200,000, last week $230,000.

2000 Sf or more 102922
2,000 SF or more closed for week ending October 29th

Contracts accepted this week

Contracts accepted this week are consistent.  156 this week compared to 160 the previous week.

Fox Valley home prices October 29th-Contracts accepted this week

Aurora-23                            Bolingbrook-16

Naperville-19                       Oswego-10

Plainfield-22

3 short sales were accepted by seller’s this week.  1 each in Lake Holiday, Montgomery, and Plainfield.  Now they will be submitted to the lender to see if they will also accept.

Seller’s accepted contracts that are contingent on the buyer closing on their current home.  1 with a kick-out clause of 72 hours, 2 with 48 hours, and also 2 with 24 hours.

Also, seller’s accepted contracts that are contingent on the buyer selling and closing on their current home.  2 with a kick-out clause of 72 hours, 3 with 48 hours, and 3 with 24 hours.

Median price of homes that went under contract this week $369,450 with 45 days average market time, last week median price $352,500 with 39 days average market time.

Contingent Stats 102922
Contingent stats for week ending October 29th

2022 by the month and a look back at 2021 and 2020

2022

Month                      New   Closed   Contracts accepted

January                     422        492            623

February                   523        520            724

March                       734         904           890

April                        1168         966          1334

May                         1101         893           806

June                         1295       1409          1234

July                           955         932           908

August                    1019        1134          1062

September               730          733           698

October                   699           612           646

Totals                    8646         8595        8925

2021

January                   543          649           829

February                 561          604            778

March                     993         1099          1455

April                     1006           926          1387

May                      1088          1288         1289

June                      1450          1686          1671

July                        1118           1182          1210

August                  1109          1203           1170

September            1083          1411            1251

October                   715           973             930

Totals                   9666        11021           11970

2020

January                 1105           566            858

February               1267           529           1024

March                    1186           707           1079

April                       648           786             775

May                       1352         1010           1444

June                       1232           908           1534

July                        1417          1453           1852

August                  1037          1335           1436

September             1176          1503           1503

October                   843           1116           1159

Totals                   11263          9913         12664

2021 was the best for closed homes.  You can see how tight this year has been with new listings.

Check back with us every Saturday for the real estate market update.  At the end of each month we take a look back at 2021 and 2020.

Resources

Click on everything that is bold and underlined to take you to the information.  If there is something we do not have listed that you are looking for just let us know.  We would be happy to  point you in the right direction.

Check with your loan officer to see what interest rate you will be offered.  It depends on your credit score a some other things they can explain to you.

You can also connect with us onFacebook.  You will also be able to search for homes there by clicking on the “shop now” button anytime you like.

All data provided today is from our MLS, MRED, LLC.  It changes continuously throughout the day as agents upload information.

Contact us

Call us at 630-503-6555 with all your real estate questions.  Your goal is our goal.

Fox Valley home prices October 29th.  Have an awesome week!

Kristine Heiman, SFR, SRS, SRES, AHWD

Designated Managing Broker

Best Homes Fox Valley

200 Webster St

Montgomery, IL 60538

630-503-6555 Ext 101
Kriss Picture 012819 3 Thumb nail

Fox Valley home prices September 24th

Fox Valley home prices September 24th.  We will show you the home prices for new listings, closed, contracts accepted, median prices, financing used and 2022 by the month.

New listings this week were up.  185 this week compared to 160 the previous week.

Closed listings were consistent.  172 this week compared to 177 the previous week.

Fox Valley homes prices September 24th

Aurora-New 20 $185,000-$719,000

             Closed-21 $122,000-$680,000

Bolingbrook-New 12 $165,000-469,000

                      Closed-20 $234,500-$775,000

Geneva-New 12 $255,000-$825,000

              Closed-11 $325,000-$707,100

Naperville-New 21 $322,000-$1,600,000

                   Closed-19 $315,000-$1,065,000

Plainfield-New 20 $237,000-$1,175,000

                  Closed-25 $255,900-$1,550,000

St Charles-New 21 $275,000-$1,699,000

                  Closed-10 $315,000-$925,000

Yorkville-New 14 $249,900-$595,000

                Closed-12 $189,000-$740,000

These are the communities with the most activity this week.  You can click on the photo above to see other communities that also had activity.

You might want to adjust what community you are looking in based on price ranges.

Financing used, median prices and 2,000 SF or more

Median price this week $399,000, last week $389,900

Closed median price this week $385,450, last week $385,000

Stats 092422
Stats for week ending September 24th

Conventional financing was used to close on 121 homes this week at median price $400,000 with 27 days average market time, last week 121 homes at median price $399,122 with 28 days average market time.

Conv 092422
Conventional financing used to close for week ending September 24th

Cash was used to close on 23 homes at median price $440,000 with 32 days average market time, last week 27 homes at median price $424,500 with 38 days average market time.

Cash 092422
Cash used to close for week ending September 24th

FHA financing was used to close on 22 homes at median price $315,000 with 24 days average market time, last week 27 homes at median price $295,000 with 26 days average market time.

FHA 092422
FHA financing used to close for week ending September 24th

VA financing was used to close on 5 homes at median price $290,000 with 15 days average market time, last week 3 homes at median price $414,000 with 24 days average market time.

VA 092422
VA financing used to close for week ending September 24th

86 homes closed that were at least 2,000 square feet or more at median price $490,000 with 33 days average market time, last week 100 homes at median price $450,000 with 30 days average market time.  Minimum price for 2,000 SF or more this week $234,000, last week $280,000.

2000 SF or more 092422
2,000 SF or more closed for week ending September 24th

Contracts accepted this week

Contracts accepted this week  were up.  190 this week compared to 169 the previous week.

Fox Valley home prices September 24th-Contracts accepted this week

Aurora-42                            Montgomery-14

Naperville-24                      Plainfield-28

St Charles-14                       Yorkville-11

Click on the photo to see other communities that seller’s accepted contracts this week.

No short sales were accepted by seller’s this week.

Seller’s accepted contracts that are contingent on the buyer closing on their current home.  4 with a kick-out clause of 72 hours, 2 with 48 hours, and 2 with 24 hours.

Also, seller’s accepted contracts that are contingent on the buyer selling and closing on their current home.  2 with a kick-out clause of 72 hours, 1 with 48 hours, and 2 with 24 hours.

Median price for homes that went under contract this week $367,450 with 50 days average market time, last week median price $364,900 with 41 days average market time.

Contingent Stats 092422
Median price of homes that went under contract for week ending September 24th

2022 by the month

Month                    New   Closed   Contracts accepted

January                   422       492               623

February                 523       520               724

March                     734       904               890

April                      1168       966              1334

May                       1101       893               806

June                       1295     1409              1234

July                         955       932               908

August                  1019      1134              1062

September              561       486                530

Totals                    7778      7736               8111

So far in September there is more new listings than closed, but almost the same that went under contract.  When this triangle shifts prices will either go up or down.

Next week is the last week of the month so we will also take a look back at 2021 and 2020 to compare how this year is going.

Check back with us every Saturday for the market update here in the Fox Valley area of Illinois.

Resources

Click on everything that is bold and underlined to take you to the site for the information.  Let us know if you are looking for other information not listed.  We would be happy to point you in the right direction.

Check with your loan officer to see what rate you will be offered.  It depends on your credit score.

To begin searching for a home you need to get pre-qualified with a loan officer, and it is best if you go ahead and get approved so you know when you do find a home that there will be no problems with the loan if it appraises out and no title issues.  No last minute issues.

It is still a good time to sell.  Let us know if you have questions.

You can also connect with us on Facebook and if you click on the “shop now” you can search for homes there.

All data provided today is from our MLS, MRED, LLC.

Contact us

Call us at 630-503-6555 with all your real estate questions.  Your goal is our goal.  We will do everything we can to help you reach your goal.

Fox Valley home prices September 24th.  Have an awesome week!

Kristine Heiman, SFR, SRS, SRES, AHWD

Designated Managing Broker

Best Homes Fox Valley

200 Webster St

Montgomery, IL 60538

630-503-6555 ext 101
 

Fox Valley home prices September 3rd

Fox Valley Home Prices September 3rd

Fox Valley home prices September 3rd.  Happy Labor Day weekend.  We will update you on new listings, closed, Contracts accepted, median prices, financing used, and 2022 by the month and a look back at 2021 and 2020.  Also, we will share some great resources for you to check out.

New listings this week were down.  162 this week compared to 214 the previous week.

Closed listings were up.  279 this week compared to 189 the previous week.

Fox Valley home prices September 3rd

Aurora-New 24 $205,000-$617,000

            Closed-41 $149,788-$300,000

Bolingbrook-New $230,000-$656,962

                      Closed-27 $216,000-$781,249

Geneva-New 6 $430,000-$1,649,800

              Closed-10 $240,117-$620,000

Montgomery-New 10 $234,999-$400,000

                       Closed-7 $219,900-$350,000

Naperville-New 22 $299,000-$6,500,000

                  Closed-46 $266,000-$1,435,000

Oswego-New 5 $399,900-$510,000

               Closed-24 $160,000-$935,000

Plainfield-New 28 $175,000-$939,000

                 Closed-30 $220,000-$1,021,000

Plano-New 2 $209,000-$475,000

           Closed-11 $127,500-$395,000

St Charles-New 9 $339,900-$1,525,000

                  Closed-18 $177,000-$780,000

Yorkville-New 8 $215,000-$439,990

                Closed-17 $190,000-$500,295

Click on the photo above to see the activity in the other communities and prices.

Median prices, financing used, and 2,000 SF or more

Median list price this week $380,000, last week $400,000.

Closed median price this week $380,000, last week $410,000.

Stats 090322
Stats for week ending September 3rd

Conventional financing was used to close on 199 homes this week at median price $410,000 with 27 days average market time, last week 149 homes at median price $429,800 with 24 days average market time.

Conv 090322
Conventional financing used to close for week ending September 3rd

Cash was used to close on 33 homes this week at median price $300,000 with 20 days average market time, last week 19 homes at median price $424,000 with 25 days average market time.

Cash 090322
Cash used to close for week ending September 3rd

FHA financing was used to close on 33 homes at median price $308,000 with 24 days average market time, last week 17 homes at median price $317,000 with 20 days average market time.

FHA 090322
FHA financing used to close for week ending September 3rd

VA financing was used to close on 11 homes at median price $305,000 with 21 days average market time, last week 4 homes at median price $402,000 with 16 days average market time.

VA 090322
VA financing used to close for week ending September 3rd

Homes that are at least 2000 square feet or more closed on 160 homes at median price $448,725 with 27 days average market time, last week 127 homes at median price $475,000 with 27 days average market time.  Minimum price this week $152,000, last week $235,000.

2000 SF or more 090322
Homes that were at least 2,000 SF or more closed for week ending September 3rd

Contracts accepted this week

Contracts accepted this week were down.  196 this week compared to 215 the previous week.

Fox Valley home prices September 3rd-Contracts accepted this week

Aurora-31                              Batavia-10

Bolingbrook-18                     Naperville-24

Plainfield-25                         St Charles-11

No short sales were accepted by seller’s this week.

Seller’s accepted contracts that are contingent on the buyer closing on their current home.  5 with a kick-out clause of 72 hours and 7 with 48 hours.

Also, seller’s accepted contracts that are contingent on the buyer selling and closing on their current home.  1 with a kick-out clause of 72 hours, 1 with 48 hours, and 3 with 24 hours.

Median price of homes that went under contract this week $363,875 with 33 days average market time, last week median price $375,000 with 38 days average market time.

Contingent Stats 090322
Contingent stats for week ending September 3rd

2022 by the month and a look back at 2021 and 2020

2022

Month                      New   Closed   Contracts accepted

January                     422       492               623

February                   523       520               724

March                       734       904               890

April                       1168        966              1334

May                        1101        893               806

June                        1295      1409             1234

July                          955        932              908

August                   1019       1134             1062

Totals                     7217       7250            7581

2021

January                   543        649              829

February                 561        604              778

March                     993       1099            1455

April                     1006         926            1387

May                      1088       1288            1289

June                      1450       1686            1671

July                        1118        1182            1210

August                  1109       1203            1170

Totals                   7868       8637           9789

2020

January                1105         566             858

February              1267         529            1024

March                   1186         707            1079

April                      648         786             775

May                     1352        1010           1444

June                     1232         908            1534

July                      1417        1453            1852

August                1037        1335            1436

Totals                 9244        7294          10002

This gives you a better picture of how things have gone in the last 3 years.  You can see why prices have increased.  

Check back with us every Saturday for the real estate market update for the Fox Valley area of Illinois.

Resources

Click on all everything that is bold and underlined to take you to the site for the information.

Check with your loan officer for the interest rate you will be offered.  It depends on your credit score.  They can also help you if you need to work on it.

If you are looking for a home you will want to find a loan officer that will put you through underwriting and get approved so yo can work out any kinks and know that if a seller accepts your offer it will go through if it appraises out and no title issues.  Why wait until a week before closing to find out?


All data provided today is from our MLS,  MRED, LLC.  It changes continuously throughout the day as agents upload their information.

Contact us

Call us at 630-503-6555 with all your real estate questions.  Your goal is our goal.  We will do everything we can to help you reach your goal.

Fox Valley home prices September 3rd.  Have a wonderful and safe Labor Day weekend!

Kristine Heiman, SFR, SRS, SRES, AHWD

Designated Managing Broker

Best Homes Fox Valley

200 Webster St

Montgomery, IL 60538

630-503-6555 ext 101
Kriss New profile for FB 123121 

Fox Valley home prices August 27th

Fox Valley Home Prices August 27th

Fox Valley home prices August 27th.  We will update you on the Fox Valley area of Illinois new, closed, contracts accepted, 2022 by the month.  Median prices and financing used for this week.

New listings this week were up.  214 this week compared to 171 the previous week.

Closed listings were down.  189 this week compared to 229 the previous week.

Fox Valley home prices August 27th

Aurora-New 42 $135,000-$799,999

             Closed-26 $160,000-$812,000

Batavia-New 10 $334,900-$900,000

              Closed-2 $329,000-$411,000

Bolingbrook-New 17 $199,900-$675,000

                      Closed-15 $240,000-$776,202

Naperville-New 31 $305,000-$2,490,000

                   Closed-41 $275,000-$1,750,000

Plainfield-New 20 $275,000-$611,848

                 Closed-31 $233,000-$650,000

St Charles-New 17 $259,000-$1,275,000

                  Closed-8 $263,000-$695,000

Yorkville-New 9 $394,990-$500,000

                 Closed-10 $125,000-$430,000

Click on the photo above to see activity in other communities this week that did not have as much action.

Median prices, financing used, and 2,000 SF or more

Median list price this week $400,000, last week $397,500.

Closed median price this week $410,000, last week $390,000.

Stats 082722
Stats for week ending August 27th

Conventional financing was used to close 149 homes with median price $429,800 with 24 days average market time, last week 177 homes at median price $399,900 with 22 days average market time.

Conv 082722
Conventional financing used to close for week ending August 27th

Cash was used to close 19 homes this week at median price $424,000 with 25 days average market time, last week 21 homes at median price $400,000 with 22 days average market time.

Cash 082722
Cash used to close for week ending August 27th

FHA financing was used to close 17 homes this week at median price $317,000 with 20 days average market time, last week 21 homes at median price $298,500 with 22 days average market time.

FHA 082722
FHA financing used to close for week ending August 27th

VA financing was used to close 4 homes this week at median price $402,000 with 16 days average market time, last week 8 homes at median price $407,500 with 30 days average market time.

VA 082722
VA financing used to close for week ending August 27th

Homes that were at least 2,000 square feet or more closed on 127 homes at median price $475,000 with 27 days average market time, last week 136 homes at median price $464,000 with 21 days average market time.  Minimum price this week $235,000, last week $220,000.

2000 SF or more 082722
Homes that were at least 2,000 SF or more for week ending August 27th

Contracts accepted this week

Contracts accepted this week were down.  215 this week compared to 228 the previous week.

Fox Valley home prices August 27th-Contracts accepted this week

Aurora-27                               Bolingbrook-16

Geneva-11                               Montgomery-10

Naperville-35                         Oswego-10

Plainfield-28                          St Charles-12

Yorkville-15

No short sales were accepted by seller’s this week.

Seller’s accepted contracts that are contingent on the closing of their current home.  5 with a kick-out clause of 72 hours, 3 with 48 hours, and 2 with 24 hours.

Also, seller’s accepted contracts that are contingent on selling and closing on their current home.  2 with a kick-out clause of 48 hours and 1 with 24 hours.

Median list price of homes that went under contract this week $375,000 with 38 days average market time, last week $365,000 with 33 days average market time.

Contingent Stats 082722
Contingent Stats for week ending August 27th

2022 by the month

Month                    New   Closed   Contracts accepted

January                   422       492                 623

February                 523       520                 724

March                     734       904                 890

April                      1168       966                1334

May                       1101       893                  806

June                       1295     1409                 1234

July                         955       932                  908

August                    857       855                  866

Totals                    7055     6971                 7385

Check back with us every Saturday for the real estate market update for the Fox Valley area of Illinois.  Next week is the end of the month so we will also take a look back at 2021 and 2020 so you can see how this year is going.

Resources

Click on everything that is bold and underlined to take you to the site for the information.

check with your loan officer for the interest rate you will be offered.  It depends on your credit score.  They can also help you if you need to work on your score.

If you need recommendations for loan officer, real estate attorney, or home inspector we can recommend  af ew of each and you can decide who you want to work with.

All data provided today is from our MLS system,  MRED, LLC.  It is constantly changing throughout the day as real estate agents upload new information.

Contact us

Call us with all your real estate questions.  Your goal is our goal.  We will do everything we can to help you reach your goal.

Fox Valley home prices August 27th.  Have an awesome week!

Kristine Heiman, SFR, SRS, SRES, AHWD

Designated Managing Broker

Best Homes Fox Valley

200 Webster St

Montgomery, IL 60538

630-503-6555 ext 101
Kriss New profile for FB 123121