How many FHA deals closed in week 31

How many FHA deals closed in week 31-Cover

How many FHA deals closed in week 31?  Some are getting accepted. Not as many as other types of loans.  We will go into more detail in a little bit.

First we will start out with new and closed listings this week and what communities are seeing the most activity.

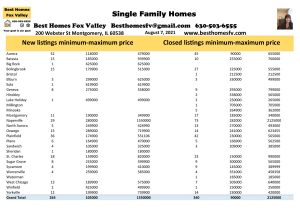
New listings of single family homes was pretty consistent.  264 this week compared to 265 the week before.  That is pretty consistent!

Closing listings of single family homes was down.  340 this week compared to 365 the week before.  This is still pretty good for the first full week of the month.  Usually it drops down.  Most buyer’s want to close at the end of the month

How many FHA deals closed in week 31

Take a look at the communities with the most activity this week:

Aurora-New 52 $118,000-$479,000

            Closed-45 $90,000-$655,000

Batavia-New 15 $185,000-$939,900

            Closed-10 $255,000-$760,000

Bolingbrook-New 15 $179,900-$515,000

                   Closed-27 $225,000-$555,000

Montgomery-New 11 $190,000-$349,900

                     Closed-17 $185,000-$340,000

Naperville-New 29 $280,000-$1,550,000

                 Closed-73 $282,000-$2,125,000

North Aurora-New 5 $249,900-$424,990

                       Closed-13 $270,000-$493,000

Oswego-New 15 $289,000-$719,900

             Closed-14 $241,000-$623,455

Plainfield-New 36 $174,900-$551,106

                Closed-42 $230,000-$565,000

St Charles-New 18 $159,900-$820,000

                  Closed-23 $150,000-$990,000

West Chicago-New 13 $189,900-$575,000

                      Closed-7 $305,000-$640,000

Yorkville-New 12 $199,900-$739,900

               Closed-14 $230,000-$420,000

Financing and median list and closed price

So many buyer’s out there are having a hard time getting their FHA offers accepted.  Some are getting through.  We will show you how many Conventional, Cash, FHA and VA deals closed.   We will start out showing you the median list and closed price.

The median list price this week is $350,000, and last week it was $373,700.

Closed median price this week is $365,000, and last week it was $390,000.

The median list and closed prices have been fluctuating up and down each week, but have stayed in the same range.
How many FHA deals closed in week 31-Stats 080721
Median List and Closed Price

Conventional deals closed this week 248, and last week 281.

Cash deals closed this week 39, and last week 38.

Conventional was down, but cash stayed consistent.
How many FHA deals closed in week 31-Conv and Cash 080721
Conventional and Cash

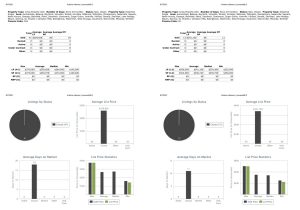
FHA deals closed this week 41, and last week 38.

VA deals closed this week 12, and last week 8.

FHA was up slightly, and VA  was slightly down.  A lot of first-time buyer’s are going with FHA financing, and they are having a hard time especially with multiple offer situations.  Hopefully they will get a break soon.
How many FHA deals closed in week 31-FHA and VA 080721
FHA and VA


Contracts accepted this week

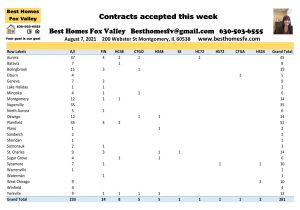
Contracts accepted this week were down.  281 this week compared to 297 the week before.  We don’t know what type of financing was chosen until they close.

How many FHa deals closed in week 31-Contracts accepted this week

Look at the communities seller’s accepted the most contracts:

Aurora-45                                Bolingbrook-19

Montgomery-14                        Naperville-35

Oswego-14                               Plainfield-51

St Charles-14                          Sycamore-10

West Chicago-10                     Yorkville-13

1 short sale was accepted buy a seller in St Charles.  It will now be submitted to the lender to see if they will also accept.  With the prices increasing not too many people have to sell for less than what they owe.  This is a great time, if you are in a bind, to sell.

Seller’s accepted contracts that are contingent on the buyer closing on their current home. 1 with a kick-out clause of 72 hours and 8 with 48 hours.

Also, seller’s accepted contracts that are contingent on the buyer selling and closing on their current home.  1 with a kick-out clause of 72 hours, 5 with 48 hours and 2 with 24 hours.

2021 by the month

Month              New     Closed     Contracts accepted

January                   543            649                  829

February                 561             604                  778

March                     993           1099                 1455

April                      1006            926                 1387

May                       1088           1228                 1289

June                      1450           1686                 1671

July                       1118            1182                 1210

August                   264             340                   281

Totals                  7023           7714                 8900

The numbers are so tight.  We started out the year with more closed then new listings, but normally the new listings would have a bigger gap between them and closed.  The contracts accepted is higher, because some homes that get a contract accepted come back on the market because of home inspection or attorney review issues.  Some appraisals are coming in lower than the contract price and it can’t go through without seller dropping price or buyer coming in with the difference in cash.

Contact us

Call us at 630-503-6555 with all your real estate questions.  Your goal is our goal.  We will do everything we can to help you reach your goal.

It is still a seller’s market so if you are thinking about selling, request a home valuation.  We will let you know what it is worth in today’s market.  Provide you with a net proceeds that shows you the expenses to sell so you can see what you have to work with.  This will be updated when an offer comes in and we know all the terms.

Thinking about buying this year?  You need to get in touch with a loan officer to get pre approved.  Get them all our financial information so they can get you through the pre approval process.  Just getting a pre-qualification is just not good enough anymore with most homes having multiple offers.  You need to be ready to go look as soon as a home hits the market and ready to write an offer.  They go fast.

Resources:

Let us know what other information you re looking for. We will point you in the right direction.

If you need recommendations for loan officers, real estate attorney and home inspectors we can provide you with a few so you can  decide who you want to work with.

How many FHA deals closed in week 31.  Have a great week!

How many FHA deals closed in week 31-Kristine Heiman, Designated Managing BrokerKristine Heiman, SFR, SRS, AHWD

Designated Managing Broker

Best Homes Fox Valley-Search for a home today!

200 Webster St

Montgomery, IL 60538

630-503-6555 Ext 101


Market update Fox Valley week 53

Market update Fox Valley week 53.  Yes week 53.  When a leap year and the first day of the year is a Wednesday we have 53 weeks in the year according to timeanddate.com.   Most of the business days this week were in 2020.

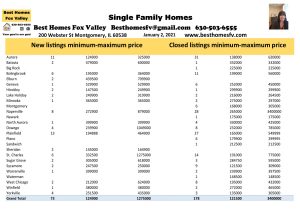
New listings of single family homes were up this week.  73 this week compared to 63 the week before.  Not too bad for in between 2 holidays.

Closed listings this week of single family homes were also slightly up.  178 this week compared to 163 the week before.

Market update Fox Valley week 53


Take a look at the communities with the most activity this week:

Aurora-New 11 $124,900-$325,000

            Closed-31 $138,000-$620,000

Bolingbrook-New 6 $195,000-$364,000

                     Closed-11 $199,000-$560,000

Naperville-New 8 $272,900-$879,000

                 Closed-28 $265,000-$3,400,000

Plainfield-New 13 $194,888-$464,900

                Closed-27 $165,000-$549,999

St Charles/Campton Hills-

                New 6 $332,500-$1,275,000

                Closed-14 $191,000-$775,000

These are the communities that perform higher than most week after week throughout the year.

Contracts accepted this week

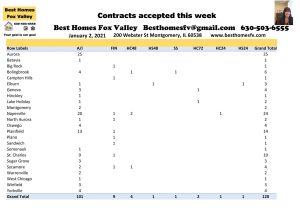
We saw a very nice increase in contracts accepted this week by sellers.  120 this week compared to 93 the week before.

Market update Fox Valley week 53-Contracts accepted this week


Buyers did not sit on the sidelines between the holidays.  2021 is expected to be more of the same as 2020.  We are hoping for more inventory so buyers have more to choose from.

Look at the communities sellers accepted the most contracts this week:

Aurora-25                             Naperville-24

Plainfield-14                         St Charles/Campton Hills-10

1 short sale was accepted by a seller this week.  It was in Bolingbrook.  Now it will be submitted to the lender to see if they will also accept.

Sellers accepted contracts that are contingent on the buyer closing on their current home. 2 with a kick-out clause of 72 hours, 4 with 48 hours and 1 with 24 hours.

Also, sellers accepted contracts that are contingent on the buyers selling and closing on their current home.  1 with a kick-out clause of 48 hours and 1 with 24 hours.

2020 by the month and a look back at 2019 and 2018

2020

Month                         New     Closed     Contracts accepted

January                     1105       566               858

February                   1267       529             1024

March                       1186       707             1079

April                            648      786                775

May                          1352    1010              1444

June                         1232       908              1534

July                          1417     1453              1852

August                     1037     1335              1436

September               1176     1503              1503

October                     843     1116               1159

November                 567        985                 699

December                 513        971                 783

Totals                   12343   11869             14146

2019

January                    878        407                 568

February                1032        463                 832

March                    1731        915              1375

April                      1594        792              1307

May                       1645        995              1280

June                       1643     1253              1218

July                        1423     1008              1090

August                   1585     1330              1196

September             1164       765                 869

October                 1041       738                 776

November                897       946                 839

December                496       638                 497

Totals                  15129   10250            11847

2018

January                   808       489                 606

February               1040       444                 856

March                   1549       907              1564

April                     1515       836              1278

May                      1569    1066               1344

June                      1828    1720               1474

July                       1318      994                1061

August                  1294    1032                  989

September            1479    1093               1078

October                1042      712                  748

November               729      739                  653

December               665      762                  602

Totals                 14836  10794             12253

Of the 3 years 2020 was the best for closed listings of single family homes.  Closed listings is the most important column to look at because these are actual numbers. 

New listing and contracts accepted both can end up listed more than once.  Sometimes agents after a couple months add them as a new listing again.  Lately not too many properties stay on the market that long though.  Listings of homes that seller accepts a contract sometimes do not make it past the home inspection and attorney review period.

Even though new listings might of been counted more than once, 2020 had the least amount of new listings with the most closed homes.  That is why prices are rising the way they are.  Inventory is severely low.

2020 also saw the most contracts accepted.  Buyers are ready to go.  They are not afraid to write the offer.  They know they are up against multiple offers so they are writing their best offer right away.

The lowest month for closed listing in 2020 was 529 in February and it was higher than the lowest month in the previous 2 years.

2018 saw the highest amount of closed listings in June and it was highest of the 3 years.  August was the highest amount of closed in 2019 but it was below the highest month of 2020 that was in September.  Most years you see the highest amount during the summer months and before school starts.  This year with e-learning you can see that the market was extended until October

Contact us

Call us at 630-503-6555 with all your real estate questions.  Your goal is our goal.  We will do everything we can to help you reach your goal.

Thinking about selling in 2021?  Request a home valuation so we can let you know what your home is worth in today’s market.  We will provide you with a net proceeds that shows you an estimate of expenses to sell your home.  This will be updated when an offer comes in and we know all the terms so you can make a good decision.

If you are wanting to buy a home in 2021 you need to get some items together and contact a loan officer. They will want a couple of years of tax returns, pay stubs, bank statements, credit card information, car payments and any other monthly payments you have.  Once they go over your credit information they will give you a letter that shows you what type of loan will work out best for you and what price.  This letter will go with an offer when you find a home.  It needs to be updated if it is older than 30 days.

Check out some great resources that might help you:

If you are looking for any other information let us know and we will point you in the right direction.  We can make recommendations for loan officers, real estate attorneys and home inspectors we have successfully worked with in the past.

Market update Fox Valley week 53.  Happy New Year!  Have a great week.

Market update Fox Valley week 53Kristine Heiman, Designated Managing Broker

Best Homes Fox Valley-Search for a home today!

200 Webster St

Montgomery, IL 60538

630-503-6555 ext 101

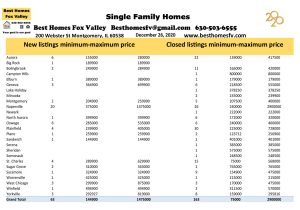
Market update Fox Valley week 52

Market update Fox Valley week 52.  The market slowed way down this week with the holiday.  Only 62 new listings of single family homes this week compared to 100 the week before.

Closed listing were also down.  163 single family homes this week compared to 242 the week before. Next week we should see a big jump because it is the last week of the month and year.

Market update Fox Valley week 52


Take a look at the communities with the most activity this week:

Aurora-New 6 $155,000-$280,000

            Closed-22 $139,000-$417,500

Bolingbrook-New 2 $249,900-$284,900

                    Closed-11 $165,000-$420,000

Naperville-New 20 $375,000-$1,475,000

                 Closed-26 $240,000-$2,900,000

Plainfield-New 4 $239,900-$405,000

                Closed-30 $225,000-$728,000

St Charles/ Campton Hills-

                 New 4 $289,900-$629,900

                 Closed-15 $75,000-$568,000

Contracts accepted this week

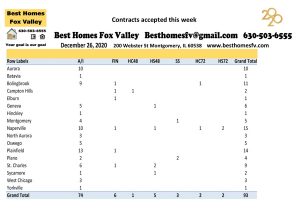
We add in the contracts accepted into the market update Fox Valley to let you see how many buyers are out there ready to write an offer that gets accepted.  In normal weeks when this starts to change you know the market is changing either for the better or not so good.

Market update Fox Valley week 52-Contracts accepted this week


Look at the communities that sellers accepted the most contracts this week:

Aurora-10                                 Bolingbrook-11

Naperville-15                            Plainfield-14

3 short sales were accepted by sellers this week. 1 in Montgomery and 2 in Plano. Now they will be submitted to the lender to see if they will also accept.

Sellers accepted contracts that are contingent on the buyer closing on their current home.  2 with a kick-out clause of 72 hours and 1 with 48 hours.

Also, sellers accepted contract that are contingent on the buyer selling and closing on their current home.  2 with a kick-out clause of 72 hours and 5 with 48 hours.

There is still confidence in the market that these will go through.

2020 by the month

Month                  New     Closed     Contracts accepted

January               1105           566               858

February             1267           529             1024

March                  1186           707             1079

April                       648          786                775

May                     1352         1010              1444

June                    1232           908              1534

July                      1417        1453               1852

August                 1037        1335               1436

September           1176        1503               1503

October                  843        1116               1159

November              567          985                 699

December              440          793                 663

Totals                 12270       11691             14026

Closed is the most important column. These are actual numbers.  September was the best month so far this year for closed single family homes.

New listings sometimes are relisted as a new listing when they are not.

Contracts accepted can sometimes not make it through the home inspection and attorney review period for many different reasons.  So both of those columns are not actual numbers.  

Next week will be the last week of the year.  We will compare this year with 2019 and 2018 so you can see how this year compares to those 2 years.

We had no idea in February how this year would go.  Buyers were out there wanting a bigger home for a home office and space for e-learning and a bigger yard.  Inventory has remained low so prices have gone up.

Contact us

Call 630-503-6555 with all of your real estate questions.  Your goal is our goal. We will do everything we can to help you reach your goal.

Thinking about selling your home?  Request a home valuation so we can update the value on your home. We will provide a net proceeds that shows an estimate of expenses to sell so you know where you are at.  This will be updated when an offer comes in and we know all the terms so you can make a good decision.

Are you thinking about buying a home in the new year?  You will need to get a couple of years tax returns, pay stubs, bank statements, credit card information, car payment information and any other payments you make monthly together and contact a loan officer to get prequalified.  They will give you a letter that shows the type of loan and the price that will work out best for you.  This will go with an offer when you find the home you like.

Check out some great resources that might help you:

Let us know if there is any other information that you are looking for.  We would be happy to point you in the right direction.

Market update Fox Valley week 52.  Happy Holidays!  Have a great week.

Market update Fox Valley week 52Kristine Heiman, Designated Managing Broker

Best Homes Fox Valley-Search for a home today!

200 Webster St

Montgomery, IL 60538

630-503-6555 ext 101

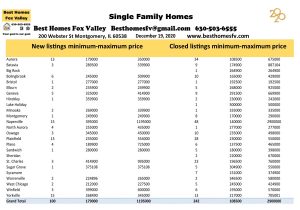
Market update Fox Valley week 51

Market update Fox Valley week 51.  New listings this week were down almost 32%.  100 new listings of single family homes this week compared to 147 the week before.  Sellers are waiting to get through the holiday at this point.  Next couple of weeks it should improve.

Closed listings were consistent with the week before.  242 closed single family homes this week compared to 241 the week before.  Next week is the last week of the month and year so there should be an increase then.

Market update Fox Valley week 51


Take a look at the communities with the most activity this week:

Aurora-New 13 $179,000-$350,000

            Closed-34 $108,500-$675,000

Bolingbrook-New 6 $245,000-$509,900

                    Closed-10 $165,000-$429,000

Naperville-New 15 $395,000-$1,195,000

                 Closed-48 $140,000-$2,900,000

Oswego-New 3 $345,000-$450,000

              Closed-10 $235,000-$498,000

Plainfield-New 13 $235,000-$554,000

                Closed-28 $230,000-$550,000

St Charles/Campton Hills-

                 New-3 $414,900-$995,000

                 Closed-23 $196,500-$760,000

Yorkville-New 15 $268,490-$345,000

              Closed-13 $217,000-$705,001

Contracts accepted this week

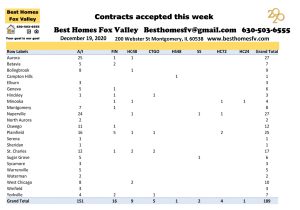
Contracts accepted this week by sellers was pretty consistent.  189 single family homes accepted this week compared to 194 the week before.  Definitely some excited buyers and sellers right before Christmas!  Finding a home or getting a contract on your home is the first step to reaching your goal.

Market update Fox Valley week 51-Contracts accepted this week


Look at the communities that sellers accepted the most contracts this week:

Aurora-27                                 Naperville-27

Oswego-12                                Plainfield-25

St Charles/Campton Hills-17     West Chicago-10

2 short sales were accepted by sellers this week.  1 each in Naperville and Sugar Grove.  Now they will be submitted to the lender to see if they will also accept.

Sellers accepted contracts that are contingent on the buyer closing on their current home.  4 with a kick-out clause of 72 hours, 9 with 48 hours and 1 with 24 hours.

Also, sellers accepted contracts that are contingent on the buyer selling and closing on their current home.  Only one this week with a kick-out clause of 48 hours.

2020 by the month

Month                         New     Closed     Contracts accepted

January                    1105        566               858

February                  1267        529             1024

March                      1186        707             1079

April                           648        786               775

May                         1352      1010             1444

June                         1232        908             1534

July                          1417      1453             1852

August                     1037       1335             1436

September               1176       1503             1503

October                      843       1116             1159

November                  567          985               699

December                  377          630               570

Totals                    12207      11528          13933

Closed listings of single family homes is the most important column to look at.  This is actual numbers.  September was the best month so far this year followed by July then August.

New listing numbers you can’t count on because some of them were canceled and relisted.  The same for contracts accepted. Some of them did not make it through the home inspection and attorney review period for many different reasons and were put back on the market and then get a contract again.

It continues to be a sellers market.  Low inventory is causing prices to go up and we are seeing multiple offers continue with so many buyers still trying to find a home.

Next week is the last week of the year.  We will compare this year to 2019 and 2018 so you can see how this year compares to the previous 2 years.

Contact us

Call us at 630-503-6555 with all your real estate questions.  Your goal is out goal.  We will do everything we can to help you reach your goal.

If you are thinking about selling your home request a home valuation so we can let you know what your home is worth in today’s market.  We will provide you with a net proceeds that shows you an estimate of expenses to sell and what you might walk away with at closing.  This will be updated when an offer comes in and we know all the terms so you can make a good decision.

Thinking about buying a home in 2021?  You need to contact a loan officer to get prequalified first.  Get 2 years of tax returns, pay stubs, bank statements, credit card payments, car payments and any other payments you make monthly together and get them to a loan officer so you can see what price range and what type of loan will work out best for you.  They will provide you with a letter that shows what you qualify for and that will go with an offer when you find the right home.  Sellers want to know that you qualify for their home before they will consider your offer.

Check out some great resources:

Let us know if you are looking for any other information and we will be happy to point you in the right direction.

Market update Fox Valley week 51.  Have a great week and Merry Christmas!

Market update Fox Valley week 51Kristine Heiman, Designated Managing Broker

Best Homes Fox Valley-Search for a home today!

200 Webster St

Montgomery, IL 60538

630-503-6555 ext 101


Market update Fox Valley week 50

Market update Fox Valley week 50


Market update Fox Valley week 50.   New listings of single family homes went up 13.08%.  147 this week compared to 130 the week before.  It bounced up slightly after the holiday.

Closed listings of single family homes went down 18.03%.  241 this week compared to 294 the week before.  It will increase as we head closer to the end of the month when most buyers want to close.

Look at the communities that had the most activity this week:

Aurora-New 23 $154,899

            Closed-38 $104,999-$525,000

Bolingbrook-New 6 $210,000-$445,000

                    Closed-15 $145,000-$426,000

Geneva-New 4 $99,000-$414,900

             Closed-15 $198,000-$685,000

Montgomery-New 2 $221,000-$295,000

                     Closed-10 $170,000-$299,900

Naperville-New 28 $267,500-$2,300,000

                 Closed-27 $241,500-$1,320,000

North Aurora-New 4 $209,000-$499,900

                      Closed-10 $206,000-$409,900

Oswego-New 11 $225,000-$695,000

             Closed-14 $226,000-$460,000

Plainfield-New 18 $212,900-$650,000

                Closed-31 $188,210-$550,000

St Charles/Campton Hills-

                New-15 $170,000-$1,295,000

                Closed-20 $233,000-$865,000

Yorkville-New 3 $205,000-$378,391

              Closed-11 $135,000-$420,000

Contracts accepted this week

Contracts accepted this week on single family homes are up 3.74%.  194 this week compared to 187 the week before.  Lower inventory and the upcoming holidays are contributing to the lower increase of activity.  People are focusing on getting ready for the holidays.

Look at the communities that sellers accepted the most contracts this week:

Aurora-37                             Bolingbrook-12

Naperville-22                        Oswego-10

Plainfield-22                         St Charles/Campton Hills-14

No short sales this week received contracts.

Sellers accepted contracts that are contingent on the buyer closing on their current home.  7 with a kick-out clause of 72 hours , 6 with 48 hours and 3 with 24 hours.

Also, sellers accepted contracts that are contingent on the buyer selling and closing on their current home.  4 with a kick-out clause of 72 hours, 4 with 48 hours and 1 with 24 hours.

It still continues to be a sellers market.  Fewer homes are going on the market but they are selling right away once they do.  If you are waiting for the New Year to put your home on the market now is a good time to discuss the process with you.

2020 by the month

Month                       New     Closed     Contracts accepted

January                  1105        566              858

February                1267        529            1024

March                    1186        707            1079

April                         648        786              775

May                       1352      1010            1444

June                       1232        908            1534

July                        1417      1453            1852

August                   1037      1335            1436

September             1176      1503            1503

October                   843       1116            1159

November               567          985              699

December               277          441              381

Totals                 12107      11339         13744

September was the best month so far in 2020 for closed homes.  Closed homes is the most important column to look at.  This is actual numbers.  New listings and contracts accepted can both have number that were counted more than once.  A new listing can be relisted as new even though it has been on the market before.  Also for contract accepted.  Sometimes a contract does not make it through the home inspection and attorney review period or something might come up on a buyers credit that did not show up initially so they do not get approved.  The home goes back on the market and gets another contract.

It really has been a better year than we expected during a pandemic.  We think 2021 will continue to be a sellers market.  Interest rates continue to be fantastic.  If you have thought about refinancing to get a better rate you might think about moving instead.

Contact us

Contact us at 630-503-6555 with all of your real estate questions.  Your goal is our goal.  We will do everything we can to help you reach your goal.

Thinking about selling your home?  Request a home valuation so we can show you what your home is worth in today’s market.  We will provide you with a net proceeds that shows you the expenses to sell so you can see where you are at.  This will be update when an offer comes in and we know all the terms.

Are you thinking about buying a home?  You will need to contact a loan officer to get prequalified.  Start a folder and put in the last 2 years of tax returns, pay stubs, bank statements, credit card information, car payment and any other payments you make monthly.  The loan officer will need this information and they might ask for it again during the loan process so it is a good idea to keep it handy.

Check out some great resources:

Let us know what information you are looking for so we can direct you in the right place.  We can do zoom meetings to go over information if that helps and you do not want to meet in person.  You can also face time video and walk me through your home so I can see it to do a market analysis.  There are 3D photo programs that can be set up if you are worried about people walking through your home.  If you haven’t seen one of them they are like walking through each room on your computer or phone.

Market update Fox Valley week 50.  Have a great week!

Market update Fox Valley week 50Kristine Heiman, Designated Managing Broker

Best Homes Fox Valley-Search for a home today!

200 Webster St

Montgomery, IL 60538

630-503-6555 ext 101

Market update Fox Valley week 49

Market update Fox Valley week 49Market update Fox Valley week 49.  New listings of single family homes are up 42.86%.  130 this week compared to 91 the week before that was Thanksgiving week.  Holidays can make a big difference.

Closed listings of single family homes were up 52.33%.  294 this week compared to 193 the week before.  When you have a holiday at the end of the month some of the closings get pushed back to beginning of the next month.  It is hard to get them all in in 3 days.

We are heading into the final weeks of the year.  Most of the sales now will most likely close in the new year unless it is a cash sale.

Take a look at the communities with the most activity this week:

Aurora-New 18 $129,900-$459,000

            Closed-43 $120,000-$449,000

Bolingbrook-New 16 $209,900-$450,990

                     Closed-21 $164,000-$560,000

Geneva-New 3 $410,000-$958,900

             Closed-12 $337,000-$815,000

Montgomery-New 3 $270,000-$335,000

                      Closed-11 $186,000-$351,000

Naperville-New 27 $288,050-$1,298,700

                 Closed-48 $270,000-$1,950,000

Oswego-New 6 $199,900-$389,900

              Closed-11 $190,000-$429,365

Plainfield-New 10 $185,873-$999,800

                Closed-27 $231,500-$389,000

St Charles/Campton Hills-

                 New 11 $250,000-$824,900

                 Closed-28 $186,000-$1,400,000

West Chicago-New 6 $214,900-$339,900

                       Closed-12 $162,000-$550,000

Yorkville-New 9 $235,000-$429,900

              Closed-15 $193,000-$359,000

Contracts accepted this week

Market update Fox Valley week 49-Contracts accepted this week


Contracts accepted this week were down 5.08%.  187 this week compared to 197 the week before.  Not too bad when the week before we were way down in new listings.  Not a lot of choices for the amount of buyers that are out there.  We are still seeing multiple offers.

You need to have a good strategy in place right now if you are a buyer.  You need to be ready to go look and not hesitate to write an offer.

Look a the communities that sellers accepted the most contracts this week:

Aurora-28                                      Bolingbrook-17

Naperville-23                                 Plainfield-31

St Charles/Campton Hills-17

2 short sales were accepted this week by sellers.  1 each in Aurora and Batavia.  Now they will be submitted to the lender to see if they will also accept.

Sellers accepted contracts that are contingent on the buyer closing on their current home.  5 with a kick-out clause of 72 hours,  2 with 48 hours and also 2 with 24 hours.

Also, sellers accepted contracts that are contingent on the buyer selling and closing on their current home.  3 with a kick-out clause of 48 hours.

2020 by the month

Month                        New      Closed     Contracts accepted

January                   1105         566              858

February                 1267         529            1024

March                     1186         707            1079

April                          648         786              775

May                         1352      1010            1444

June                         1232        908            1534

July                          1417      1453            1852

August                     1037      1335            1436

September               1176      1503            1503

October                     843      1116             1159

November                 567        985                699

December                 130        294                187

Totals                   11960    11192           13550

The closed column is the most important one.  These numbers show you what actually happened.  New listings and contracts accepted columns are inflated with homes that could of been relisted as new or received a contract and did not go through and then received another contract.

September so far is the best month for closed homes.  Usually it drops off a little after school starts but not this year.  It is still a sellers market.  There are more buyers than homes for sale.  This has caused prices to rise.  Interest rates are still fantastic!

Some people don’t realize how good the market is right now.  They think because of the pandemic the market is not moving but it sure is.

Contact us

Call us at 630-503-6555 with all your real estate questions.  Your goal is our goal.  We will do everything we can to help you reach your goal.

Thinking about selling your home?  Request a home valuation and we will let you know what your home is worth in today’s market.  We will provide you with a net proceeds that shows you an estimate of expenses to sell so you will have an idea of what you have to work with.  This will be updated when an offer comes in and we know all the terms so you can make a good decision.

Are you thinking about buying a home?  Your first step is to get a couple of years tax returns, pay stubs, bank statements and any other thing that you pay monthly like credit cards or car payments together.  Call a loan officer to get prequalified.  They will provide you with a letter showing the type of loan and the price that will work out best for you.  When you find a home we will need to send this with an offer to show sellers that you qualify.

Check out some great resources:

If you need any other information let us know and we will point you in the right direction.  Do you need recommendations for real estate attorneys, home inspectors or information on radon?  Let us know and we will provide you with people that we have worked with before or we can send you pamphlets on the information that you are looking for.

Market update Fox Valley week 49.  Have a great week!

Market update Fox Valley week 49Kristine Heiman, Designated Managing Broker

Best Homes Fox Valley-Search for a home today!

200 Webster St

Montgomery, IL 60538

630-503-6555 ext 101

Market update Fox Valley week 48

Market update Fox Valley week 48.  New listings of single family homes are down 39.34%.  91 this week compared to 150 the week before.  It is a holiday week so that makes it tough.  This week we should bounce back.

Market update Fox Valley week 48


Closed listings of single family homes were also down 37.34%.  193 this week compared to 308 the week before.  When a holiday is at the end of the month closings either get moved up or pushed back.

Take a look at the communities that had the most activity this week:

Aurora-New 14 $114,900-$449,995

            Closed-27 $60,000-$663,000

Bolingbrook-New 5 $209,900-$345,000

                     Closed-16 $140,000-$359,000

Naperville-New 12 $384,900-$1,325,000

                 Closed-25 $330,000-$760,000

Oswego-New 3 $234,000-$435,000

              Closed-13 $252,000-$575,000

Plainfield-New 14 $185,000-$849,900

                Closed-18 $208,000-$790,000

St Charles/Campton Hills-

                New 9 $224,900-$899,000

                Closed-19 $138,000-$775,000

Yorkville-New 2 $359,990-$369,000

              Closed-12 $239,900-$495,000

Contracts accepted this week

Market update Fox Vallley week 48-Contracts accepted this week


Contracts accepted on single family homes are down by 13.22%.  197 this week compared to 227 the week before.  That is not too bad for a holiday week!

Look at the communities that sellers accepted the most contracts this week:

Aurora 29                                   Bolingbrook-22

Naperville-35                              Plainfield-23

St Charles/Campton Hills-17

Only 1 short sale was accepted this week by a seller.  It was in Naperville.  Now it will be submitted to the lender to see if they will also accept.

Sellers accepted contracts that are contingent on the buyer closing on their current home.  3 with a kick-out clause of 72 hours, 4 with 48 hours and 1 with 24 hours.

Also, sellers accepted contracts that are contingent on the buyer selling and closing on their current home.  2 with a kick-out clause of 72 hours, 5 with 48 hours and 1 with 24 hours.

2020 by the month and a look back at 2019 and 2018

Month                         New     Closed     Contracts accepted

January                    1105        566               858

February                  1267        529             1024

March                      1186        707             1079

April                           648        786               775

May                         1352      1010             1444

June                         1232        908             1534

July                          1417      1453             1852

August                     1037      1335             1436

September               1176      1503             1503

October                     843       1116             1159

November                 567          985               699

Totals                   11830      10898          13363

2019

January                    878           407              568

February                1032           463              832

March                    1731           915            1375

April                      1594           792            1307

May                       1645           995            1280

June                       1643        1253            1218

July                        1423        1008            1090

August                   1585        1330            1196

September             1164          765               869

October                 1041          738               776

November                897          946               839

Totals                   14633       9612           11350

2018

January                   808           489               606

February               1040           444               856

March                   1549           907            1564

April                     1515           836            1278

May                      1645           995            1280

June                     1828         1720            1474

July                      1318           994            1061

August                 1294         1032              989

September           1479         1093            1078

October               1042           712               748

November             729            739               653

Totals                14247         9961          11587

Closed is the most important column to look at.  These are actual numbers and 2020 is doing the best so far comparing to 2019 and 2018.

New listings for 2020 is way behind 2019 and 2018 but these numbers are not accurate.  Some of these have been relisted as new even though they have been on the market.  New construction has helped buyers that are looking and just can’t find anything.  Homeowners don’t realize how many buyers are out there looking.  They think because of the pandemic that housing isn’t moving.  We are still getting multiple offers on homes.  Inventory of homes for sale has been severely low for a few years causing pricing to really go up this year but interest rates are fantastic.

Contracts accepted numbers are also not accurate.  Some of these contracts do not make it through the home inspection and attorney review period.  They go back on the market and then get another contract.   Buyers in this market know they have to be ready to write a contract or they will lose out on a home.

Check back with us every Saturday for the market update Fox Valley.  At the end of each month we will compare to 2019 and 2018.

Contact us

Call us at 630-503-6555 with all your real estate questions.  Your goal is our goal.  I will do everything I can to help you reach your goal.

Buyers are looking for a home that is ready to move into. If you are thinking about selling make sure you pack everything away.  Fresh paint does wonders.  Make sure your home is sparkling clean or they will just move onto the next home.  Request a home valuation so we can show you what it is worth in today’s market.  I will provide you with a net proceeds that shows you an estimate of the expenses of selling a home.  This will be updated when an offer comes in and we know all the terms.

Are you thinking about buying a home?  Get a couple of years tax returns, pay stubs, bank statements and any monthly loans or credit cards you have together.  Contact a loan officer and get prequalified.  They will provide you with a letter showing the type of loan and what price would work out best for you.  This will go with an offer when you find a home so you can show the owner that you do qualify to buy their home.  Need a recommendation?  Let us know and I will provide you with a few that we have successfully worked with and you can decide who you want to work with.

Check out some great resources:

Let us know if there is any other information you are looking for.  We will be happy to point you in the right direction.

Market update Fox Valley week 48.  I hope you enjoyed a great Thanksgiving.  Have a great week!

Market update Fox Valley week 47

Market update Fox Valley week 47


Market update Fox Valley week 47.  New listings of single family homes were about the same.  150 this week compared to 152 the week before.  This is typical for this time of year before the holidays but this year the amount of buyers out there ready to buy is not getting satisfied.  Multiple offers are a common thing right now.  Buyers are using escalation clauses, waiving home inspections and trying to be creative to win.

Closings on single family homes this week were up 54.77%.  308 this week compared to 199 the week before. Next week is going to be a short week with the Thanksgiving holiday so that is why there is such an increase.

Take a look at the communities with the most activity this week:

Aurora-New 17 $139,900-$385,000

            Closed-41 $70,070-$510,000

Batavia-New 5 $297,500-$489,500

             Closed-15 $174,000-$855,000

Bolingbrook-New 10 $169,900-$344,900

                     Closed-20 $155,000-$507,670

Geneva-New 8 $255,000-$792,000

             Closed-19 $235,000-$625,000

Minooka-New 3 $275,000-$288,150

               Closed-14 $124,000-$650,000

Montgomery-New 5 $189,900-$289,900

                      Closed-13 $141,277-$295,000

Naperville-New 26 $299,900-$1,400,000

                 Closed-44 $270,000-$1,775,000

Oswego-New 12 $299,900-$529,900

              Closed-20 $248,000-$525,000

Plainfield-New 19 $184,000-$749,000

                Closed-34 $182,500-$565,000

St Charles/Campton Hills-

                 New-10 $237,900-$889,900

                 Closed-16 $225,500-$548,000

Yorkville-New 2 $199,000-$299,390

              Closed-16 $235,000-$849,000

Most of these communities consistently see higher activity.  Is that what you are looking for or a smaller more stable community?

Contracts accepted this week

Market update Fox Valley week 47-Contracts accepted this week


Contracts accepted this week on single family homes were down 5.02%.  227 this week compared to 239 the week before.  With only 152 new listings added last week this turned out better than expected.

Look at the communities sellers accepted the most contracts:

Aurora-33                             Bolingbrook-17

Geneva-10                            Naperville-34

Plainfield-30                         St Charles/Campton Hills-15

West Chicago-12                  Yorkville-11

2 short sales were accepted this week.  1 each in Bolingbrook and North Aurora.  Now they will be submitted to the lender to see if they will also accept.

Sellers accepted contracts that are contingent on the buyers closing on their current home. 6 with a kick-out clause of 72 hours and 7 with 48 hours.

Also, sellers accepted contracts that are contingent on the buyer selling and closing on their current home.  2 with a kick-out clause of 72 hours and also 2 with 48 hours.

Sellers still have confidence in the market to accept these contingencies.  It has been a crazy year but the market has been good!

2020 by the month

Month                         New     Closed     Contracts accepted

January                    1105        566                 858

February                  1267        529               1024

March                      1186        707               1079

April                           648        786                 775

May                         1352      1010               1444

June                         1232        908               1534

July                          1417      1453               1852

August                     1037       1335              1436

September               1176       1503              1503

October                     843        1116              1159

November                 476           792                699

Totals                    11739      10705           13363

The closed column is the most important one to look at.  These are actual numbers.  New and contracts accepted might not be because of listings relisted as new even though they are not.  Contracts can get accepted and not make it through the home inspection and attorney review period and go back on the market and then come up as contract accepted again.

Check back with us next week and we will also look back at 2019 and 2018.  I do that at the end of each month so you can see how the market is doing compared to those other 2 years.

Contact us

Call us at 630-503-6555 with all of your real estate questions.  Your goal is our goal.  I will do whatever I can to help you reach your goal.

Thinking about selling your home?  Request a home valuation and we will show you what it is work in today’s market.  I will provide you with a net proceeds that shows you an estimate of expenses to sell.  This will be updated when an offer comes in and we know all the terms.

Are you thinking about buying a home?  Get your tax returns for 2 years, check stubs, bank statements and anything you pay monthly together and call a loan officer to get prequalified.  They will tell you the price range and what type of loan will work out best for your situation.  If you need recommendations I would be happy to give you a few names and numbers to contact and you can choose who you want to work with.  They will give you a letter showing what you qualify for and that will go with an offer when you find a home.  If it is older than 30 days it will need to be updated.

Check out some great resources:

If you are looking for other types of information let me know I would be happy to tell you where to look.  Some of the links provided also give you other information that you might be interested in.

Market update Fox Valley week 47.  Have a great week!

Market update Fox Valley week 47Kristine Heiman, Designated Managing Broker

Best Homes Fox Valley-Search for a home today!

200 Webster St

Montgomery, IL 60538

630-503-6555 ext 101

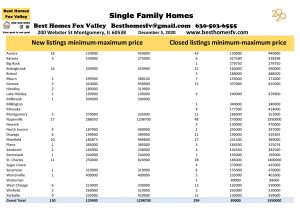
Market update Fox Valley week 46

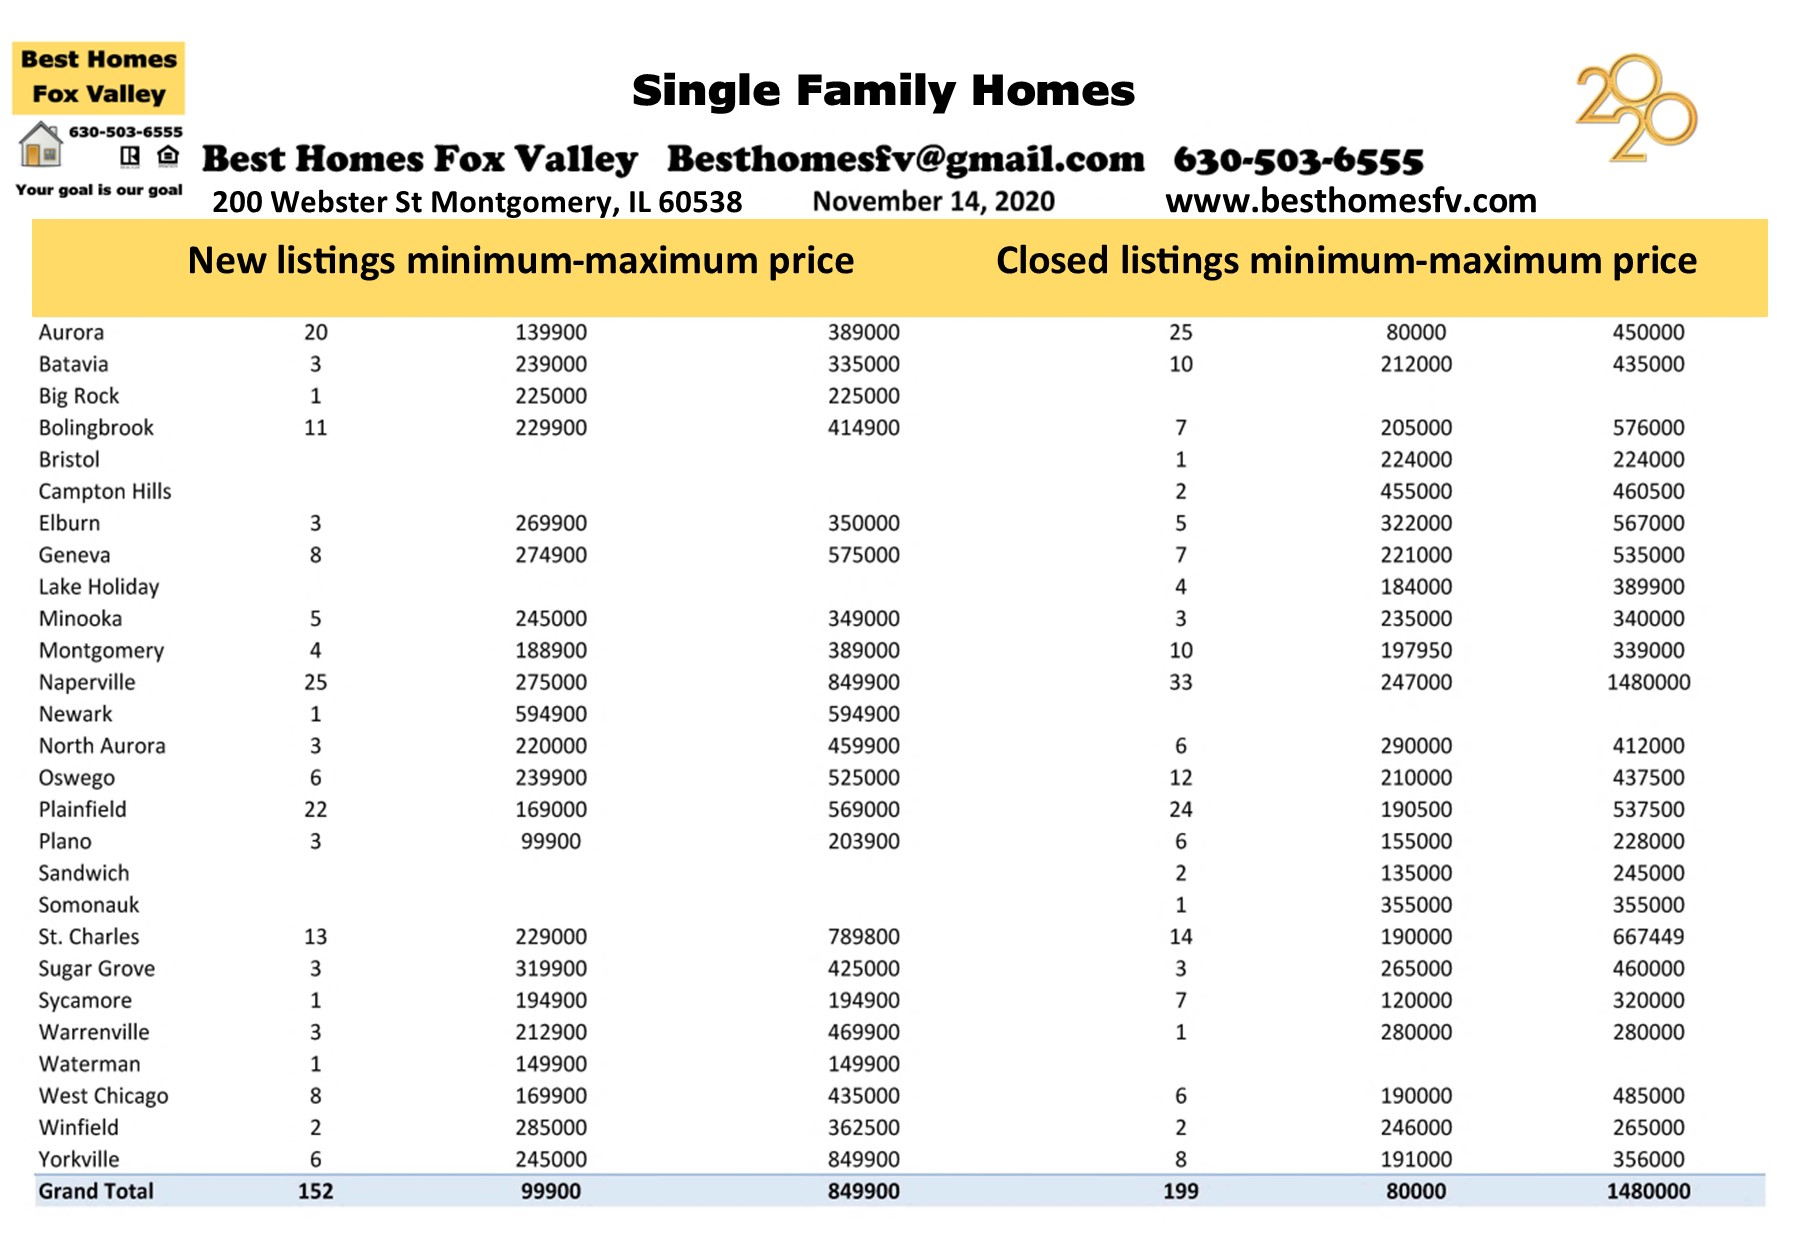
Market update Fox Valley week 46Market update Fox Valley week 46.  New listings of single family homes are down 12.64%.  152 this week compared to 174 the week before.  We are definitely not listing enough homes to meet the demand of buyers.

Closed listings of single family homes are also down by 30.18%.  199 this week compared to 285 the week before.  Closings in the beginning of the month are to be expected.  Most buyers want to close at the end of the month.

Take a look at the communities with the most activity this week:

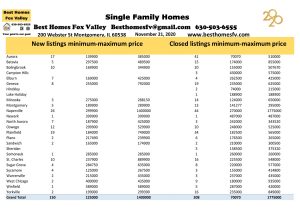
Aurora-New 20 $139,900-$389,000

            Closed-25 $80,.000-$450,000

Batavia-New 3 $239,000-$335,000

             Closed-10 $212,000-$435,000

Bolingbrook-New 11 $229,900-$414,900

                     Closed-7 $205,000-$576,000

Montgomery-New 4 $188,900-$389,000

                     Closed-10 $197,950-$339,000

Naperville-New 25 $275,000-$849,900

                 Closed-33 $247,000-$1,480,000

Oswego-New 6 $239,900-$525,000

              Closed-12 $210,000-$437,500

Plainfield-New 22 $169,000-$569,000

               Closed-24 $190,500-$537,500

St Charles/Campton Hills-

                New-13 $229,000-$789.800

               Closed-14 $190,000-$667,449

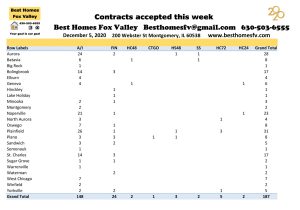
Contracts accepted this week

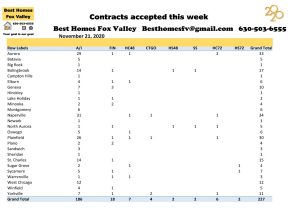
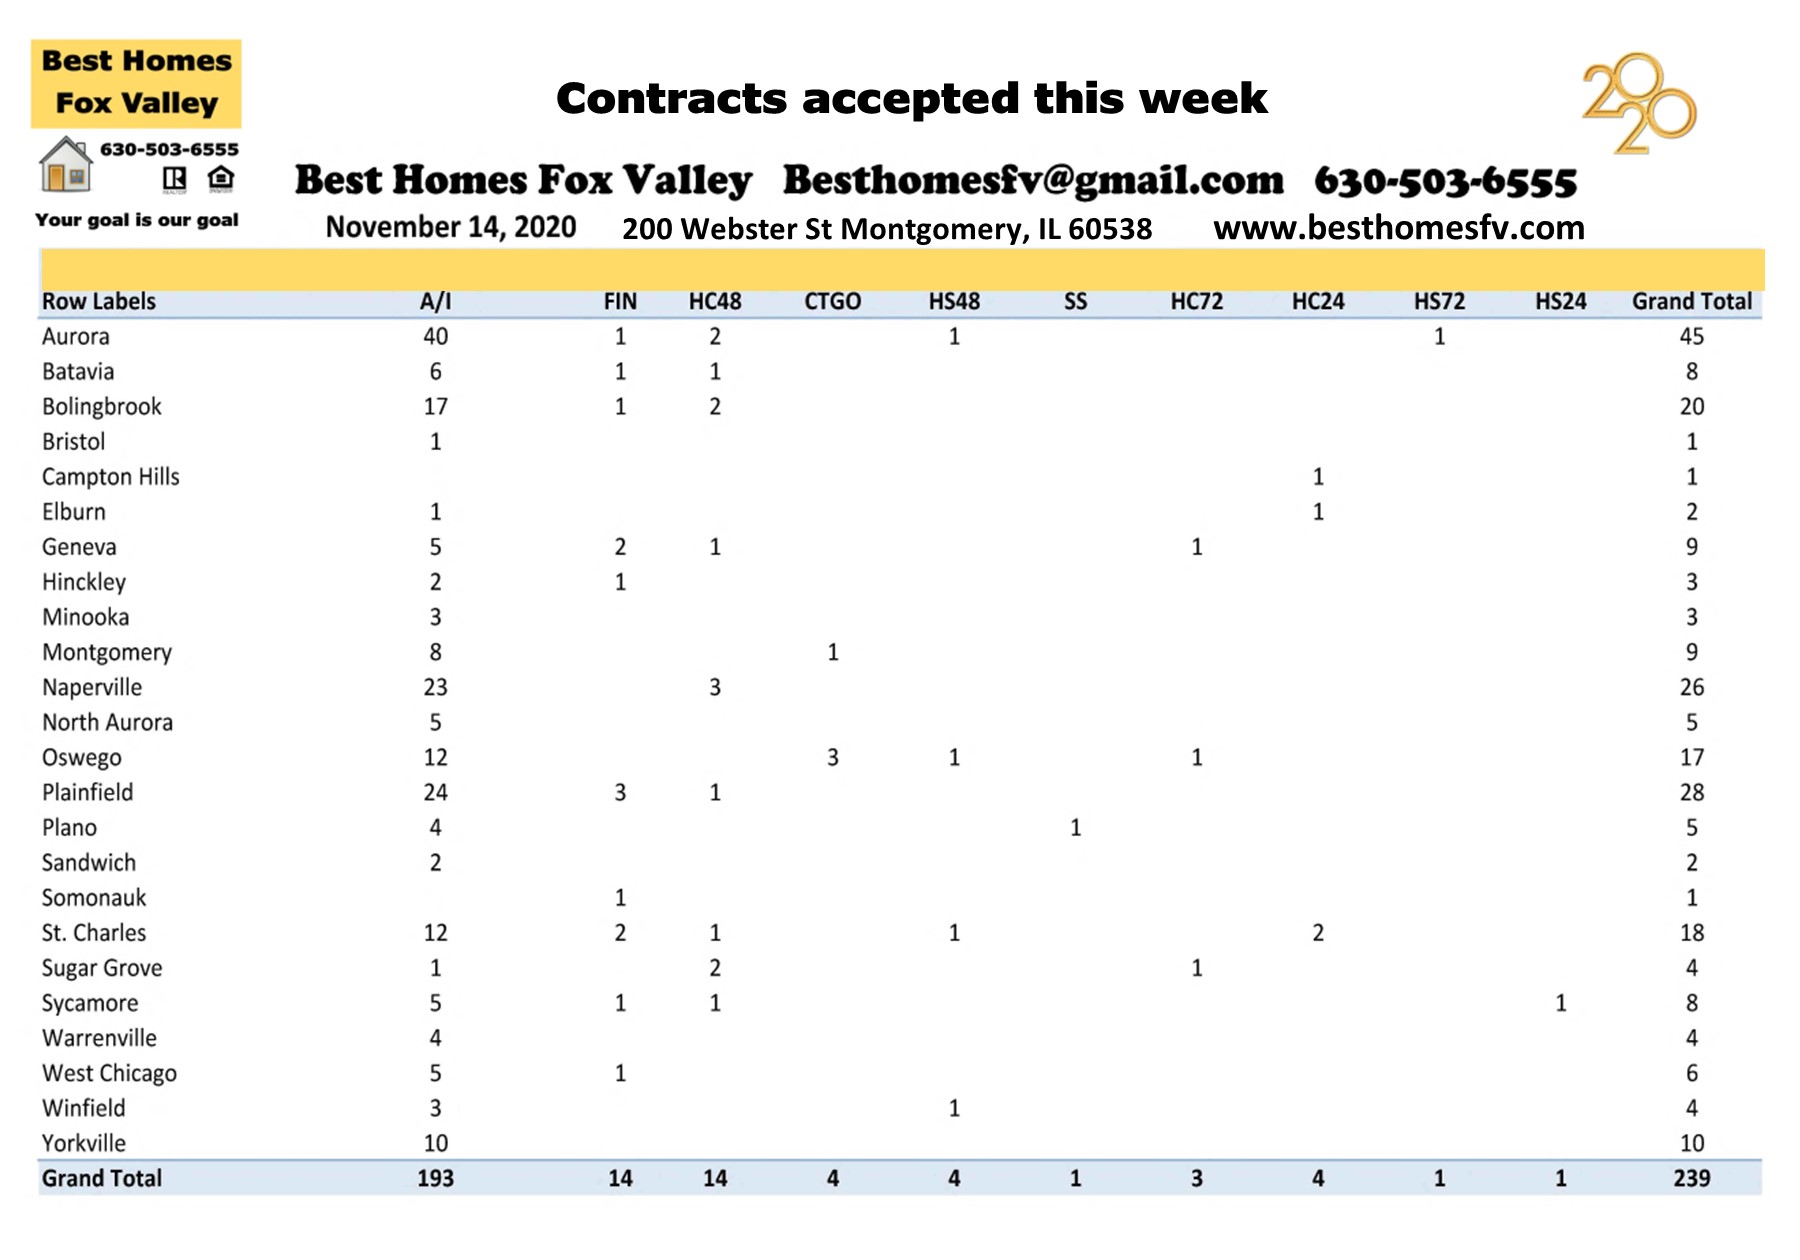
Market update Fox Valley week 46-Contracts accepted this weekContracts accepted this week on single family homes were very consistent.  239 this week compared to 233 the week before.  Even though there were less listings this week buyers were still finding a home.  They fought for them with multiple offers in a lot of cases.

Look at the communities sellers accepted the most contracts:

Aurora-45                             Bolingbrook-20

Naperville-26                        Oswego-17

Plainfield-28                         St Charles/Campton Hills-18

Yorkville-10

Only 1 short sale was accepted by a seller this week.  It was in Plano.  Now it will be submitted to the lender to see if they will also accept.

Sellers accepted contracts that are contingent on the buyer closing on their current home.  3 with a kick-out clause of 72 hours, 14 with 48 hours and 4 with 24 hours.

Also, sellers accepted contracts that are contingent on the buyer selling and closing on their current home.  1 with a kick-out clause of 72 hours, 4 with 48 hours and 1 with 24 hours.

2020 market update by the month

Month                         New     Closed     Contracts accepted

January                    1105        566               858

February                  1267        529             1024

March                      1186        707             1079

April                          648        786                775

May                         1352     1010              1444

June                         1232       908              1534

July                          1417     1453              1852

August                     1037     1335              1436

September               1176     1503              1503

October                      843     1116              1159

November                  326        484                472

Totals                     11589   10397           13136

September is the best month so far this year for closed single family homes.  This is the only column with actual numbers you can count on.

New listings can be relisted as new.  Some agents do this so it does not look like it has been on the market very long.

Contract accepted may not end up closing because of home inspection issues or attorney review items could not be satisfactory negotiated.  They might be reactivated and then go contract pending again.  So you can’t count on these numbers.

At the end of each month I will compare to 2019 and 2018 so you can get an idea of how this year is going compared to those years.

Contact us

Call us at 630-503-6555 with all of your real estate questions.  Your goal is our goal.  We will do everything we can to help you reach your goal.

Request a home valuation if you are thinking about selling your home.  We will provide you with a net proceeds that gives you an estimate of the expenses to sell.  This will be updated  when an offer comes in and we know all the terms so you can make a good decision.

Are you thinking about buying a home?  You need to get your tax returns, check stubs, bank statements and any monthly payments like car payments together and contact a loan officer so they can prequalify you.  They will provide you with a letter that shows what price and what type of loan you qualify for.  When you find a home this will go with an offer so you can show the seller you do qualify for their home.

Check out some great resources:

Also check with your lender for any special programs they have.  You might be able to combine down payment assistance with some of their programs.

Homes are selling like hotcakes so if you are thinking about selling now is a great time!

Check back with us every Saturday for the market update.  Call us in-between with any questions or if you see something you would like to take a look at.

Market update Fox Valley week 46.  Have a great week!

Market update Fox Valley week 46Kristine Heiman, Designated Managing Broker

Best Homes Fox Valley-Search for a home today!

200 Webster St

Montgomery, IL 60538

630-503-6555 ext 101

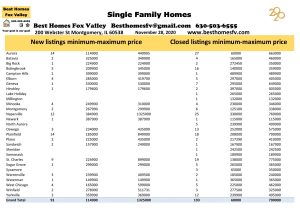
Market update Fox Valley week 45

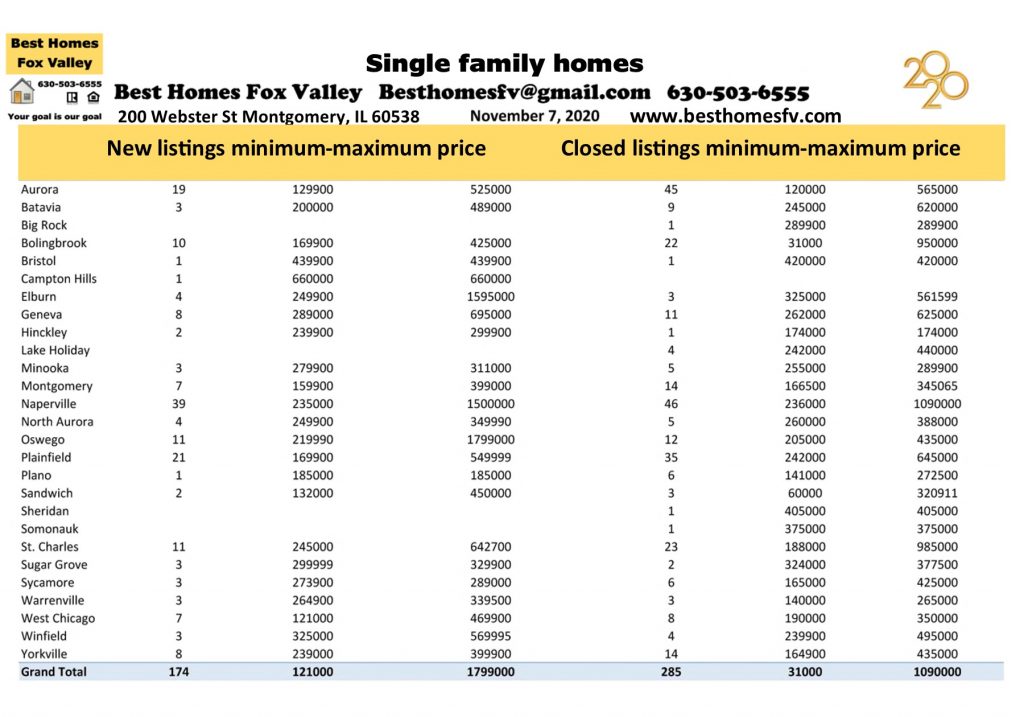
Market update Fox Valley week 45Market update Fox Valley week 45.  New listings of single family homes were down almost 8%.  174 this week compared to 189 the week before.  Hopefully next week this will improve.  Buyers are still waiting for homes to come on the market.  Competition is very low right now so this is the perfect time to sell.

Closed listing of single family homes were also down just under 7%.  285 this week compared to 306 the week before.  This is the first week of the month so that is to be expected.  Most buyers want to close at the end of the month.

Take a look at the communities with the most activity this week:

Aurora-New 19 $129,900-$525,000

            Closed-$45 $120,000-$565,000

Bolingbrook-New 10 $169,900-$425,000

                     Closed-22 $31,000-$950,000

Geneva-New 8 $289,000-$695,000

             Closed-11 $262,000-$625,000

Montgomery-New 7 $159,900-$399,000

                      Closed-14 $166,500-$345,065

Naperville-New 39 $235,000-$1,500,000

                 Closed-46 $236,000-$1,090,000

Oswego-New 11 $219,990-$1,799,000

              Closed-12 $205,000-$435,000

Plainfield-New 21 $169,900-$549,999

                Closed-35 $242,000-$645,000

St Charles/Campton Hills-

                New 11 $245,000-$642,700

                Closed-23 $188,000-$985,000

Yorkville-New 8 $239,000-$399,900

              Closed-14 $164,900-$435,000

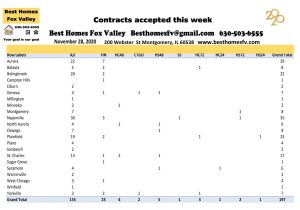
Contracts accepted this week

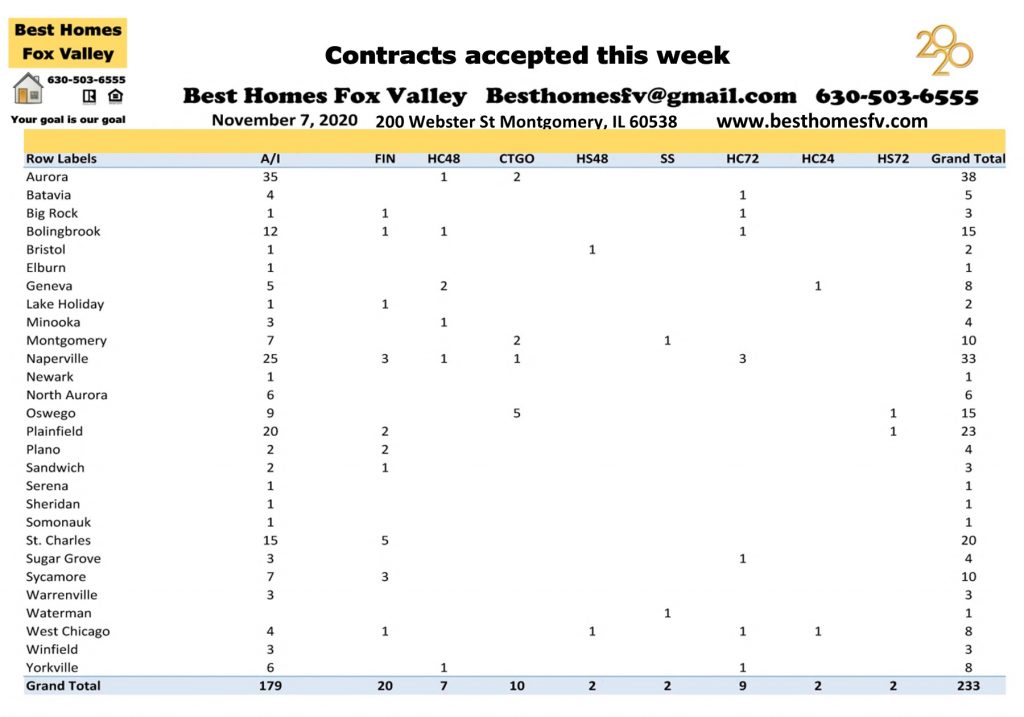
Market update Fox Valley week 45-Contracts accepted this weekContracts accepted this week were also down this week just under 13%.  233 this week compared to 267 the week before.  Extremely low inventory and now this week going even lower does not help.  Buyers are putting in offers and having to deal with multiple offer situations.  Increasing prices also does not help.  With such low inventory prices have been going up higher and higher.  We are even having a hard time coming up with comparables for the increase in prices.

Look at the communities that sellers accepted the most contracts this week:

Aurora-38                                    Bolingbrook-15

Montgomery-10                           Naperville-33

Oswego-15                                   Plainfield-23

St Charles/Campton Hills-20        Sycamore-10

2 short sales were accepted by sellers this week.  1 each in Montgomery and Waterman.  Now they will be submitted to the lender to see if they will also accept.

Sellers accepted contracts that are contingent on the buyer closing on their current home.  9 with a kick-out clause of 72 hours, 7 with 48 hours and 2 with 24 hours.

Also, sellers accepted contracts that are contingent on the buyer selling and closing on their current home.  2 with a kick-out clause of 72 hours and also 2 with 48 hours.

2020 by the month

Month                         New     Closed     Contracts accepted

January                    1105        566               858

February                  1267        529             1024

March                      1186        707             1079

April                           648        786               775

May                          1352     1010             1444

June                          1232       908             1534

July                           1417     1453             1852

August                      1037      1335             1436

September                1176      1503             1503

October                      843      1106             1159

November                  174         285               233

Totals                     11437    10198          12897

July was the best month for new listings.  September was the best month for closed listings.  July was also the best month for contracts accepted.

Closed listings is the one to really look at.  This is actual numbers.  They definitely closed.  New listings sometimes get relisted as new even though they are not new to the market.  The same for contracts accepted. The might get accepted and don’t go through to closing and go back on the market.

July used to be a very slow month when most people were gone on vacation.  This year because of the pandemic July was very busy.  Some people do not realize how active the housing market has been throughout this year.

Check back with us every Saturday for a market update Fox Valley.  At the end of each month I compare to the previous 2 years so you have something to compare this year to.

Contact us

Call us at 630-503-6555 with all of your real estate questions.  Your goal is our goal.  We will do everything we can to help you reach your goal.

Even with the pandemic it is a great time to sell.  Buyers are out there waiting for something to come on the market to see.  Request a home valuation and we will let you know what your home is worth in today’s market.  We will provide you with a net proceeds that shows you an estimate of expenses to sell.  This will be update when an offer comes in and we know all the terms so you can make a good decision.

Thinking about buying a home?  You need to contact a loan officer first to see what type of loan and what price range will work out best for you.  They will give you a letter showing what you qualify for and it will go with an offer when you find a home.  It can’t be older than 30 days or you will need to have the loan officer update it.

Check out some great resources:

Let us know what questions you have or what kind of information you are looking for so we can direct you to it.

Market update Fox Valley week 45.  Have a great week!

Market update Fox Valley week 45Kristine Heiman, Designated Managing Broker

Best Homes Fox Valley-Search for a home today!

200 Webster St

Montgomery, IL 60538

630-503-6555 ext 101