Fox Valley home prices December 14th

Fox Valley home prices December 14th

 Fox Valley home prices December 14th.  37 and raining today.  We will go up to 46 on Monday and then downhill from there to a high of 24.  Not bad for a couple of weeks before Christmas.

New listings this week are way down.  95 this week compared to 121 the previous week.

Closed listings are up.  171 this week compared to 159 the previous week.

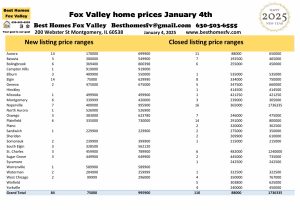
Here are the communities with the most activity this week.

Aurora New-11 $179,900-$539,681

             Closed-16 $135,000-$691,329

Bolingbrook New-7 $334,900-$650,000

                      Closed-12 $226,000-$909,742

Elgin New-6 $250,000-$495,000

          Closed-14 $195,000-$768,000

Naperville New-10 $479,900-$975,000

                   Closed-18 $390,000-$1,755,000

Oswego New-8 $350,000-$643,490

               Closed-11 $290,000-$625,770

Plainfield New-20 $345,000-$839,000

                 Closed-24 $308,000-$830,303

South Elgin New-1 $239,000

                    Closed-13 $267,000-$807,345

St Charles New-5 $340,000-$1,550,000

                  Closed-14 $260,000-$874,000

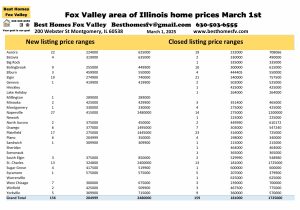
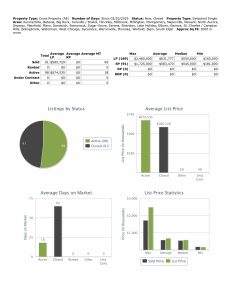
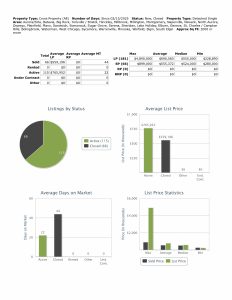
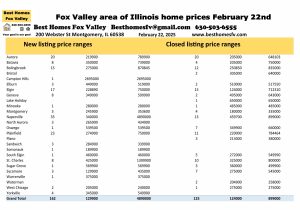
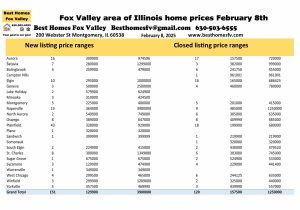
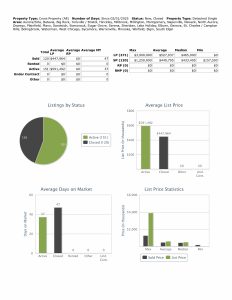
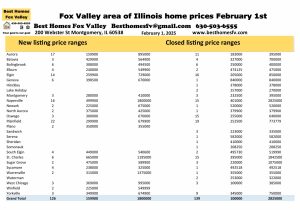
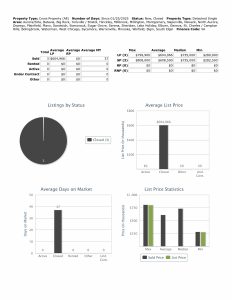
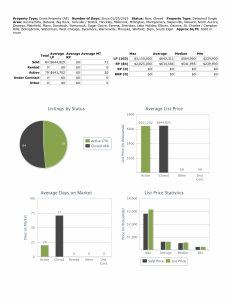
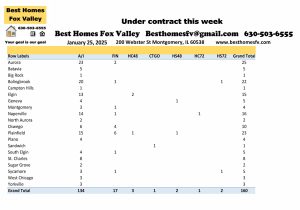
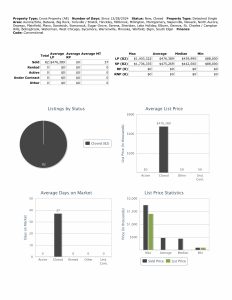
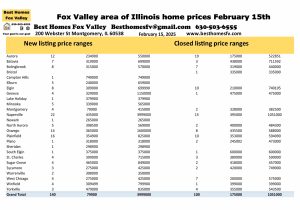
Other communities had activity.  You can see them and their price ranges in the photo above.

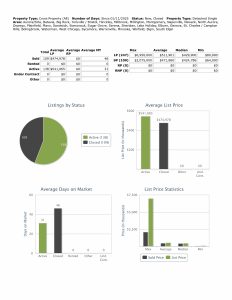
Financing most used, median prices, and 2,000 SF or more

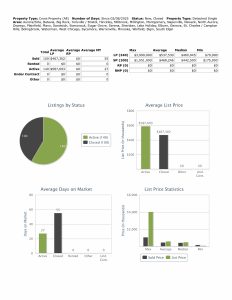
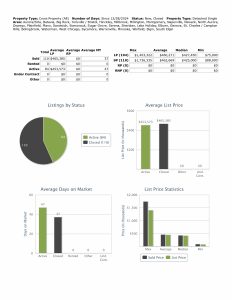
Median list price this week $435,720, last week $435,995.

Closed median price this week $435,000, last week $423,255.

Stats 121424
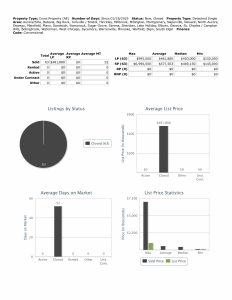
Stats for week ending December 14th

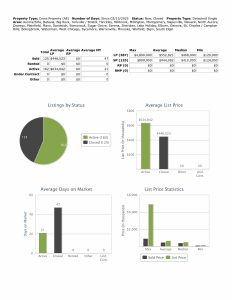
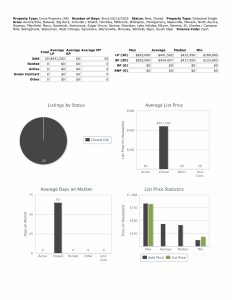
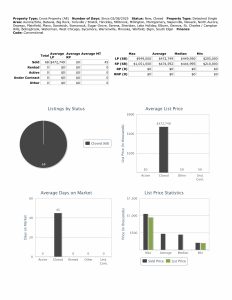
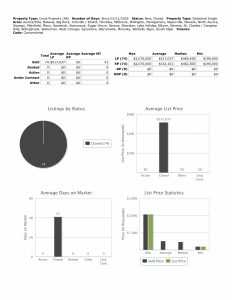
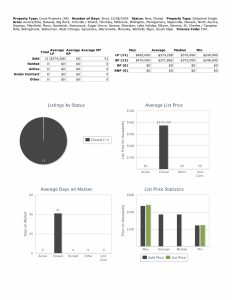
Conventional financing was used to close on 131 homes this week at median price $435,000 with 55 days average market time, last week 118 homes at median price $419,127 with 36 days average market time.

Conv 121424
Conventional financing used to close for week ending December 14th

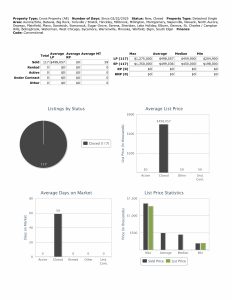
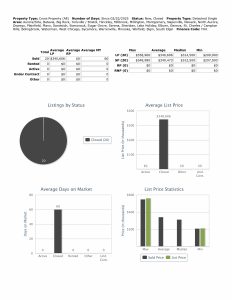
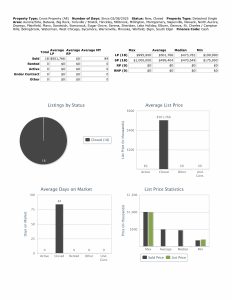
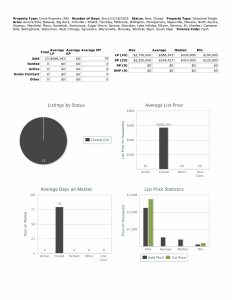
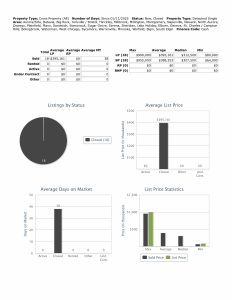
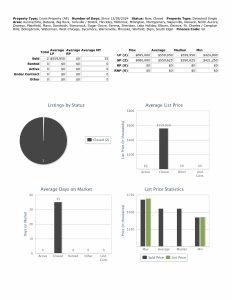
Cash was used to close on 24 homes this week at median price $512,500 with 33 days average market time, last week 27 homes at median price $440,000 with 48 days average market time.

Cash 121424
Cash used to close for week ending December 14th

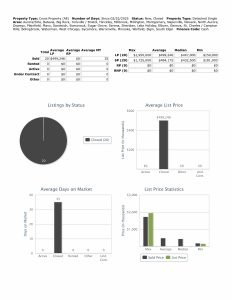
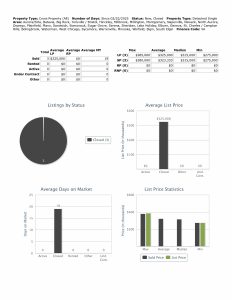
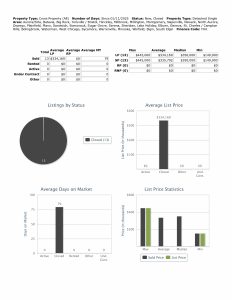
FHA financing was used to close on 10 homes this week at median price $357,500 with 32 days average market time, last week 11 homes at median price $350,000 with 25 days average market time.


FHA 121424
FHA financing used to close for week ending December 14th

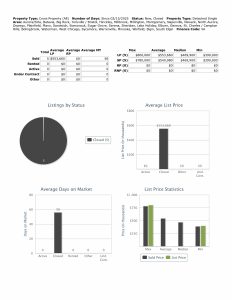
VA financing was used to close on 4 homes this week at median price $438,750 with 98 days average market time, last week 2 homes at median price $351,500 with 34 days average market time.

VA 121424
VA financing used to close for week ending December 14th

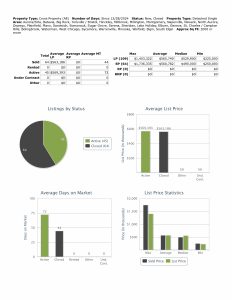
2,000 SF or more closed on 100 homes this week at median price $525,000 with 54 days average market time, last week 89 homes at median price $519,500 with 41 days average market time.  Minimum price this week $300,000, last week $317,000.

2000 SF or more 121424
2,000 SF or more closed for week ending December 14th

Every week the inventory of homes is different.

This week over 76 percent of homes used conventional financing to close on a home.  As long as we are in a seller’s market I do not see this changing.

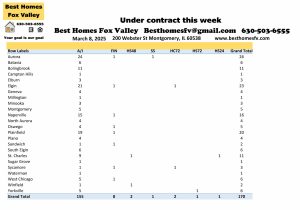
Under contract this week

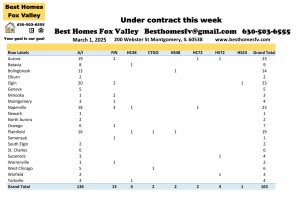
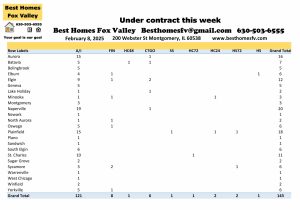
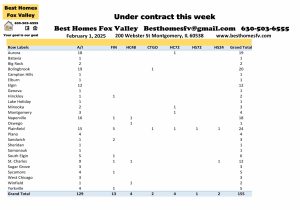
Homes that went under contract this week are up slightly.  126 this week compared to 107 the previous week.

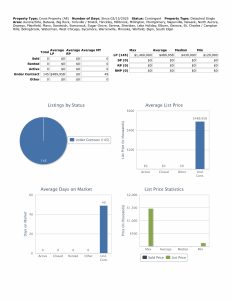
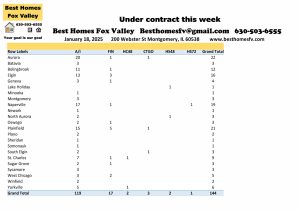
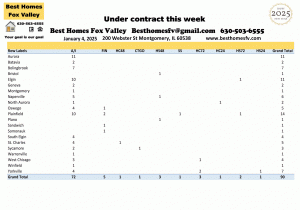
Fox Valley home prices December 14th-Under contract this week

Aurora-14                     Elgin-13

Naperville-11                Plainfield-13

1 short sale was accepted by a seller this week.  It was in Sycamore.

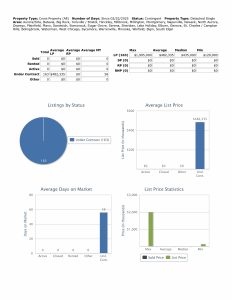
Seller’s accepted contracts that are contingent on the buyer closing on their current home.  2 with a kick-out clause of 72 hours and 4 with 48 hours.

Also, seller’s accepted contracts that are contingent on the buyer selling and closing on their current home.  2 with a kick-out clause of 72 hours and also 2 with 48 hours.

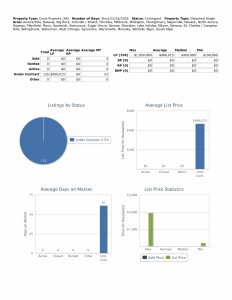
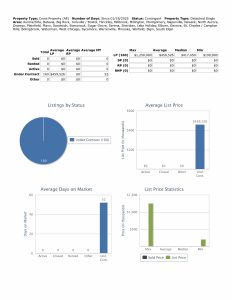
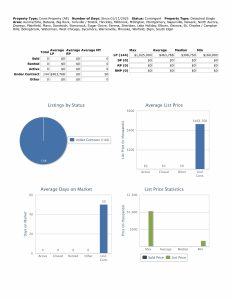
Median price of homes that went under contract this week $388,450 with 54 days average market time, last week $429,900 with 65 days average market time.

Under contract stats 121424
Under contract stats for week ending December 14th

2024 by the month

Month               New   Closed   Under contract

January              576       523            599 

February             637      416            691

March                 674       612            792

April                   800      688            801

May                   1077    1002           1075

June                  1009     906             918

July                    1173    1050           1094

August               883      858             725

September         849      734             777

October              990      936            878

November           587     659             601

December            216     330             333

Totals                 9471   8714           9284

Check back with us every Saturday for the real estate market update for the Fox Valley area of Illinois.  At the end of each month we also take a look back at 2023 and 2022.

Contact us

Call us at 630-503-6555 with all your real estate questions.  Your goal is our goal.

Click on everything that is bold and underlined to take you to this information.

You can also request a home valuationsign-up for email alerts, and search for a home anytime.

There is a big difference between a home inspection, city/village inspection, and appraisal.  Please ask me to explain it to you.  There is a lot to go over.  You need to take the time and let us explain the process to you.

All data provided today was downloaded from our MLS MRED, LLC.  It changes throughout the day as agents upload their information.

Fox Valley home prices December 14th.  Have an awesome week!

Kristine Heiman, Designated Managing Broker

SFR, SRS, SRES, AHWD

Best Homes Fox Valley

200 Webster St

Montgomery, IL 60538

630-503-6555 Ext 101

Fox Valley home prices December 7th

Fox Valley home prices December 7th

Fox Valley home prices December 7th.   45 for a high today and partly cloudy.  This next week it will range from 23 for a high to 51.  Up and down all week.  That is some pretty good temps for our area in December.

New listings this week are up.  121 this week compared to 83 the week before.  Last week was Thanksgiving week so it was a short week.

Closed listings are up slightly.  159 this week compared to 149 the previous week.

Here is the communities with the most activity this week in the Fox Valley area of Illinois.

Aurora New-15 $179,999-$985,913

            Closed-21 $205,000-$563,040

Bolingbrook New-8 $249,900-$559,000

                    Closed-12 $299,900-$1,029,967

Elgin New-9 $265,000-$617,990

         Closed-10 $215,000-$520,000

Naperville New-11 $437,900-$639,500

                 Closed-22 $277,000-$1,457,517

Plainfield New-16 $345,000-$659,900

                Closed-18 $235,000-$661,000

St Charles New 3 $799,900-$1,100,000

                  Closed-11 $390,000-$1,200,000

Sycamore New-11 $215,000-$469,940

                 Closed-4 $248,000-$375,000

Look at the photo above to see the other communities that had activity this week and their price ranges.

Financing used, median prices, and 2,000 SF or more

Median list price this week $435,995, last week $434,945.

Closed median price this week $423,255, last week $434,990.

Stats 120724
Stats for week ending December 7th

Conventional financing was used to close on 118 homes this week at median price $419,127 with 36 days average market time, last week 116 homes at median price $455,945 with 46 days average market time.

Conv 120724
Conventional financing used to close for week ending December 7th

Cash was used to close on 27 homes this week at median price $440,000 with 48 days average market time, last week 17 homes at median price $460,000 with 64 days average market time.

Cash 120724
Cash used to close for week ending December 7th

FHA financing was used to close on 11 homes this week at median price $350,000 with 25 days average market time, last week 14 homes at median price $377,500 with 29 days average market time.

FHA 120724
FHA financing used to close for week ending December 7th

VA financing was used to close on 2 homes this week at median price $351,500 with 34 days average market time, last week 2 homes at median price $354,999 with 13 days average market time.

VA 120724
VA financing used to close for week ending December 7th

 2,000 SF or more closed on 89 homes at median price $519,500 with 41 days average market time, last week 89 homes at median price $559,900 with 53 days average market time.  Minimum price this week $317,000, last week $245,000.

2000 SF or more 120724
2,000 SF or more closed for week ending December 7th

74 percent of homes closed this week used conventional financing.  Median list price this week was consistent and median closed price went up slightly. A little over half of the homes closed this week were at least 2,000 Square feet or more.

Under contract this week

Fox Valley home prices December 7th-Under contract this week

Homes that went under contract this week are down.  107 this week compared to 121 the previous week.

Communities seller’s accepted the most contracts this week.

Aurora-19                   Plainfield-13

1 short sale was accepted by a seller this week.  It was in Geneva.

Seller’s accepted contracts that are contingent on the buyer closing on their current home.  2 with a kick-out clause of 72 hours and 2 with 24 hours.

Also, seller’s accepted contracts that are contingent on the buyer selling and closing on their current home.  2 with a kick-out clause of 72 hours and 1 with 48 hours.

Median price of homes that went under contract this week $429,900 with 65 days average market time, last week $429,900 with 53 days average market time.

under contract stats 120724
Under contract stats for week ending December 7th

Market time has increased.  There are still homes that receive contracts right away.  If you get your home market ready and price it right it will still move quickly.

2024 by the month

Month       New   Closed   Under contract

January         576        523            599

February       637         416            691

March           674         612            792

April             800         688            801

May             1077        1002          1075

June            1009         906            918

July             1173        1050          1094

August          883         858            725

September    849        734             777

October        990        936             878

November      587       659             601

December      121         159             107

Totals      9376    8543       9058

Check back with us every Saturday for the real estate market update for the Fox Valley area of Illinois.  At the end of each month we will also take a look back at 2023 and 2022 so you have something to compare to.

Contact us

Call us at 630-503-6555 with all your real estate questions.  Your goal is our goal.

Here is some great resources to check out.  Click on everything that is bold and underlined to take you to the information.

You can also request a home valuationsign-up for email alertssearch for a home anytime.

Talk to your loan officer to find out about all the programs that they offer.

All data provided today was downloaded from our MLS, MRED, LLC.  It changes throughout the day as agents upload their information.

Fox Valley home prices December 7th.  Have an awesome week!

Kristine Heiman, Designated Managing Broker

SFR, SRS, SRES, AHWD

Best Homes Fox Valley

200 Webster St

Montgomery, IL 60538

630-503-6555 Ext 101
Fox Valley home prices November 30th

Fox Valley home prices November 30th

Fox Valley home prices November 30th.  Winter temperatures are here!  26 degrees for a high today with lots of sun. This next week we will see from the mid 20’s to upper 30’s.

New listings are way down.  83 this week compared to 147 the previous week.  I think that is because of Thanksgiving.  Hopefully next week will be better.

Closed listings are also down.  149 this week compared to 198 the previous week.

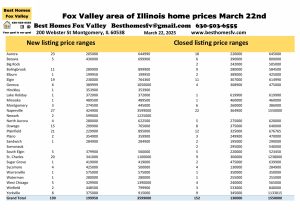
Here are the communities with the most activity this week.

Aurora New-8 $204,000-$514,900

            Closed-15 $195,000-$577,000

Elgin New-18 $82,900-$669,530

         Closed-19 $160,000-$720,000

Naperville New-1 $540,000

                 Closed-14 $400,000-$2,100,000

Plainfield New-8 $295,000-$850,000

                Closed-20 $284,873-$695,000

South Elgin New-0

                   Closed-10 $320,000-$710,420

St Charles New-7 $324,000-$799,900

                  Closed-11 $310,000-$1,089,000

Yorkville New 2 $459,990-$565,000

               Closed-10 $310,000-$785,000

Take a look at the photo above for the other communities that had activity this week and their price ranges.

Financing used, median prices, and 2,000 SF or more

Median list price this week $434,945, last week $435,000.

Closed median price this week $434,990, last week $418,750.

Stats 113024
Stats for week ending November 30th

Conventional financing was used to close on 116 homes this week at median price $455,945 with 46 days average market time, last week 143 homes at median price $430,000 with 36 days average market time.

Conv 113024
Conventional financing used to close for week ending November 30th

Cash was used to close on 17 homes this week at median price $460,000 with 64 days average market time, last week 24 homes at median price $340,000 with 50 days average market time.

Cash 113024
Cash used to close for week ending November 30th

FHA financing was used to close on 14 homes this week at median price $377,500 with 29 days average market time, last week 20 homes at median price $372,900 with 31 days average market time.

FHA 113024
FHA financing used to close for week ending November 30th

VA financing was used to close on 2 homes this week at median price $354,999 with 13 days average market time, last week 11 homes at median price $435,000 with 61 days average market time.

VA 113024
VA financing used to close for week ending November 30th

2,000 SF or more closed on 89 homes this week at median price $559,900 with 53 days average market time, last week 113 homes at median price $520,000 with 48 days average market time.  Minimum price this week $245,000, last week $225,000.

2000 SF or more 113024
2,000 SF or more closed for week ending November 30th

Almost 78% of homes closed this week used conventional financing.

Under contract this week

Homes that went under contract this week are slightly down.  121 this week compared to 149 the previous week.

Fox Valley home prices November 30th-Under contract this week

Aurora-17                    Naperville-13

Plainfield-17

No short sales were accepted by seller’s this week.

Seller’s accepted contracts that are contingent on the buyer closing on their current home.  1 with a kick-out clause of 72 hours, 3 with 48 hours, and 1 with 24 hours.

Also, seller’s accepted contracts that are contingent on the buyer selling and closing on their current home.  3 with a kick-out clause of 72 hours and 1 with 48 hours.

Median price of homes that went under contract this week $429,900 with 53 days average market time, last week $415,000 with 53 days average market time.

Under contract Stats 113024
Under contract stats for week ending November 30th

2024 by the month and a look back at 2023 and 2022

2024

Month        New   Closed   Under contract

January           576       523             599

February         637        416             691

March              674       612             792

April                800       688             801

May                1077     1002            1075

June               1009      906              918

July                1173     1050            1094

August             883       858             725

September       849      734             777

October           990       936             878

November        587       659              601

Totals        9255   8384        8951

2023

January            483      326              470

February          630      526              789

March              555      558              726

April                 710      617              755

May                  735      603              816

June               1030     1059              926

July                  765      745              805

August              869      988              915

September        684      621              623

October            639      568              549

November          601      497              363

Totals         7701  7108        7737

2022

January             422      492              623

February            523     520              724

March                734      904              890

April                 1168      966             1334

May                   1101      893              806

June                 1295    1409             1234

July                    955     932               908

August               1019    1134             1062

September         730      733              698

October             699       612              646

November          574       764             624

Totals         9220   9359        9549

We are definitely doing better this year than we did last year.  2022 was still a better year though.

Check back with us every Saturday for the real estate market update for the Fox Valley area of Illinois.  At the end of each month we take a look back at 2023 and 2022 like we did today. 

Next month is the last month of the year.  I might go back to 2020 instead of looking at just 3 years.

Contact us

Call us at 630-503-6555 with all your real estate questions.  Your goal is our goal.

Check out these great resources.

You can also request a home valuation, sign-up for email alerts, and search for a home anytime.

All data provided today was downloaded from our MLS, MRED, LLC.  It changes throughout the day.

Fox Valley home price November 30th.  Have an awesome week!

Kristine Heiman, Designated Managing Broker

SFR, SRS, SRES, AHWD

Best Homes Fox Valley

200 Webster St

Montgomery, IL 60538

630-503-6555 Ext 101
Fox Valley home prices November 23rd

Fox Valley home prices November 23rd

Fox Valley home prices November 23rd.  We saw our first snowfall the other day.  It melted right away though.  This next week will be mostly in the 30’s.

New listings this week are down.  147 this week compared to 166 the previous week.

Closed listings are up.  198 this week compared to 169 the previous week.

Here are the communities with the most activity this week.

Aurora-New 21 $180,000-$670,000

             Closed-25 $200,000-$915,000

Batavia-New 11 $224,900-$789,900

             Closed-8 $264,000-$600,000

Bolingbrook-New 10 $199,900-$808,971

                    Closed-9 $319,900-$1,125,000

Elgin-New 20 $186,777-$718,990

         Closed-23 $182,500-$600,000

Naperville-New 18 $425,000-$3,200,000

                  Closed-23 $375,000-$1,350,000

Oswego-New 9 $359,000-$587,997

              Closed-13 $279,000-$609,767

Plainfield-New 18 $225,000-$639,900

                 Closed-25 $320,000-$1,330,000

St Charles-New 5 $350,000-$1,199,000

                   Closed-15 $58,500-$1,310,000

Other communities had activity this week.  You can see them and their price ranges in the photo above.

Financing used, median prices, and 2,000 SF or more

Median list price this week $435,000, last week $449,000.

Closed median price this week $418,750, last week $417,500.

Stats 112324
Stats for week ending November 23rd

Conventional financing was used to close on 143 homes this week at median price $430,000 with 36 days average market time, last week 123 homes at median price $437,200 with 42 days average market time.

Conv 112324
Conventional financing used to close for week ending November 23rd

Cash was used to close on 24 homes at median price $340,000 with 50 days average market time, last week 24 homes at median price $401,000 with 32 days average market time.

Cash 112324
Cash used to close for week ending November 23rd

FHA financing was used to close on 20 homes at median price $372,900 with 31 days average market time, last week 15 homes at median price $375,000 with 22 days average market time.

FHA 112324
FHA financing used to close for week ending November 23rd

VA financing was used to close on 11 homes at median price $435,000 with 61 days average market time, last week 7 homes at median price $490,000 with 37 days average market time.

VA 112324
VA financing used to close for week ending November 23rd

2,000 SF or more closed on 113 homes this week at median price $520,000 with 48 days average market time, last week 100 homes at median price $512,111 with 45 days average market time.  Minimum price this week $225,000, last week $275,000.

2000 SF or more 112324
2,000 SF or more closed for week ending November 23rd

Only 10% percent of homes closed this week using FHA financing. If you don’t have cash, conventional is the way to go.

Under contract this week

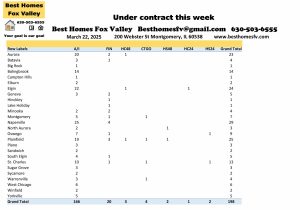
Fox Valley home prices November 23rd-Under contract this week

Homes that went under contract this week are down.  149 this week compared to 168 the previous week.

Aurora-15                        Bolingbrook-14

Naperville-15                   Oswego-10

Plainfield-18                     St Charles-15

1 short sale was accepted by a seller this week.  It was in Bolingbrook.

Seller’s accepted contracts that are contingent on the buyer closing on their current home.  1 with a kick-out clause of 72 hours, 6 with 48 hours, and 1 with 24 hours.

Also, seller’s accepted contracts that are contingent on the buyer selling and closing on their current home.  3 with a kick-out clause of 72 hours, 2 with 48 hours, and 1 with 24 hours.

Under contract median price this week $415,000 with 53 days average market time, last week $399,000 with 48 days average market time.

Under contract 112324
Under contract stats for week ending November 23rd

2024 by the month

Month           New   Closed   Under contract

January               576        523           599

February             637         416           691

March                  674        612           792

April                    800        688           801

May                    1077      1002         1075

June                   1009       906           918

July                    1173      1050         1094

August                 883       858           725

September          849        734          777

October              990        936          878

November            504        510          480

Totals          9172    8235     8830

Check back with us every Saturday for the real estate market update for the Fox Valley area of Illinois.

At the end of each month we will also take a look back at 2023 and 2022 so you have something to compare to.

Contact us

Call us at 630-503-6555 with all your real estate questions.  Your goal is our goal.

Here are some resources for you to check out.  Click on everything that is bold and underlined to take you to the information.

You can also request a home valuation, sign-up for email alerts, and search for a home anytime.

All data provided today was downloaded from our MLS, MRED, LLC.  The data changes throughout the day.

Fox Valley home prices November 23rd.  Have an awesome week!

Kristine Heiman, Designated Managing Broker

SFR, SRS, SRES, AHWD

Best Homes Fox Valley 

200 Webster St

Montgomery, IL 60538

630-503-6555 Ext 101
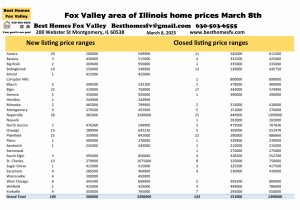
Fox Valley home prices November 16th

Fox Valley home prices November 16th

Fox Valley home prices November 16th.  Cloudy day today in the 50’s.  This next week we will see between 40 degrees to 60 for highs and lows from 54 to 31 degrees.

New listings this week are down.  166 this week compared to 191 the previous week.

Closed listings are up.  169 this week compared to 143 the previous week.

Here are the communities with the most activity this week.

Aurora-New 14 $69,000-$819,900

             Closed-28 $145,000-$1,025,000

Bolingbrook-New 9 $320,000-$539,900

                    Closed-14 $270,000-$531,000

Elgin-New 13 $159,900-$629,990

         Closed-16 $260,000-$678,280

Naperville-New 18 $349,900-$1,250,000

                  Closed-11 $400,000-$1,150,000

Plainfield-New 27 $354,900-$812,000

                Closed-31 $270,000-$952,000

St Charles-New 10 $299,900-$874,900

                  Closed-11 $235,270-$985,000

Look at the photo above to see the other communities that had activity this week and their price ranges.

Financing used, median prices, and 2,000 SF or more

Median list price this week $449,000, last week $448,350.

Closed median price this week $417,500, last week $445,000.

Stats 111624
Stats for week ending November 16th

Conventional financing used to close on 123 homes this week at median price $437,200 with 42 days average market time, last week 112 homes at median price $475,000 with 39 days average market time.

Conv 111624
Conventional financing used to close for week ending November 16th

Cash was used to close on 24 homes this week at median price $401,000 with 32 days average market time, last week 23 homes at median price $376,000 with 26 days average market time.

Cash 111624
Cash used to close for week ending November 16th

FHA financing was used to close on 15 homes this week at median price $375,000 with 22 days average market time, last week 6 homes at median price $330,000 with 48 days average market time.

FHA 111624
FHA financing used to close for week ending November 16th

VA financing used to close on 7 homes this week at median price $490,000 with 37 days average market time. last week 1 home at $490,000 with 4 days average market time.

VA 111624
VA financing used to close for week ending November 16th

2,000 SF or more closed on 100 homes this week at median price $512,111 with 45 days average market time, last week 92 homes at median price $528,000 with 48 days average market time.  Minimum price this week $275,000, last week $680? (mistake that wasn’t corrected).

2000 SF or more 111624
2,000 SF or more closed for week ending November 16th

Over 72 % of homes closed this week used conventional financing.  59% of homes closed this week were at least 2,000 SF or more.

Under contract this week

Fox Valley home prices November 16th-Under contract this week

Homes that went under contract this week are consistent.  168 this week compared to 163 the previous week.

Aurora-22                            Bolingbrook-10

Elgin-22                                Naperville-20

Plainfield-19                          St Charles-14

No short sales were accepted by seller’s this week.

Seller’s accepted contracts that are contingent on the buyer closing on their current home.  6 with a kick-out clause of 48 hours and 3 with 24 hours.

Also, seller’s accepted contracts that are contingent on the buyer selling and closing on their current home.  1 with a kick-out clause of 72 hours, 3 with 48 hours, and 1 with 24 hours.

Median price of homes that went under contract this week $399,000 with 48 days average market time, last week median price was $435,000 with 58 days average market time.

Under contract stats 111624
Under contract stats for week ending November 16th

2024 by the month

Month          New   Closed    Under contract

January              576       523                599

February            637        416                691

March                674        612                792

April                   800       688                801

May                   1077      1002              1075

June                  1009       906                918

July                   1173      1050              1094

August                883       858                725

September          849       734                777

October              990       936                878

November           357        312                331

Totals          9025    8037        8681

There is activity every month of the year.  

Check back with us every Saturday for the real estate market update for the Fox Valley area of Illinois.

At the end of each month we will also take a look back at 2023 and 2022.

Contact us

Call us at 630-503-6555 with all your real estate questions.  Your goal is our goal.

Check out some great information by clicking on everything that is bold and underlined.  It will take you to the information.  If you are looking for other information not listed let us know and we will point you in the right direction.

You can also request a home valuation,sign-up for email alerts, and search for a home anytime.

All data provided today was downloaded from our MLS, MRED, LLC.  It changes throughout the day.

Fox Valley home prices November 16th.  Have an awesome week!

Kristine Heiman, Designated Managing Broker

SFR, SRS, SRES, AHWD

Best Homes Fox Valley

200 Webster St

Montgomery, IL 60538

630-503-6555 Ext 101

Fox Valley home prices November 9th

Fox Valley home prices November 9th

Fox Valley home prices November 9th.  It looks like we will be in the 50’s this next week.  Not bad for November.

New listings this week are up.  191 this week compared to 151 the previous week.

Closed listings are down.  143 this week compared to 226 the previous week.

Here are the communities that had the most activity this week.

Aurora-New 26 $240,000-$675,000

             Closed-12 $172,000-$515,000

Elgin-New 19 $229,900-$612,490

         Closed-14 $285,000-$610,000

Naperville-New 23 $400,000-$4,100,000

                  Closed-17 $336,000-$1,875,000

Plainfield-New 33 $240,000-$919,000

                Closed-17 $680 (?)-$695,000

South Elgin-New 2 $510,000-$575,000

                    Closed-10 $250,000-$654,720

St Charles-New 14 $275,000-$1,035,000

                   Closed-9 $350,000-$1,620,000

Yorkville-New 12 $339,900-$625,000

               Closed-5 $398,000-$725,000

Other communities also had activity this week.  You can see them and their price ranges in the photo above.

Financing used, median prices, and 2,000 SF or more

Median list price this week $448,350, last week $450,000

Closed median price this week $445,000, last week $463,120.

Stats 110924
Stats for week ending November 9th

Conventional financing was used to close on 112 homes this week at median price $475,000 with 39 days average market time, last week 175 homes at median price $480,000 with 35 average market time.

Conv 110924
Conventional financing used to close for week ending November 9th

Cash was used to close on 23 homes this week at median price $376,000 with 26 days average market time, last week 30 homes at median price $590,000 with 28 days average market time. 

Cash 110924
Cash used to close for week ending November 9th

FHA financing was used to close on 6 homes this week at median price $330,000 with 48 days average market time, last week 16 homes at median price $300,500 with 25 days average market time.

FHA 110924
FHA financing used to close for week ending November 9th

VA financing was used to close on 1 home this week at $490,000 with 4 days average market time, last week 5 homes at median price $473,990 with 37 days average market time.

VA 110924
VA financing used to close for week ending November 9th

2,000 SF or more closed on 92 homes this week at median price $528,000 with 48 days average market time, last week 143 homes at median price $570,000 with 38 days average market time.  Minimum price this week $680 (?), last week $263,000.

2000 SF or more 110924
2,000 SF or more closed for week ending November 9th

78% or the homes closed this week used conventional financing.  Too bad someone uploaded the price wrong in Plainfield this week and threw the stats out of whack.

Under contract this week

Homes that went under contract this week are up slightly.  163 this week compared to 155 the previous week.

Fox Valley home prices November 9th-Under contract this week

Aurora-21                Elgin-14

Naperville-20           Plainfield-18

St Charles-12           Sycamore-10

There were 2 short sales accepted by seller’s this week.  1 in Bolingbrook and 1 in Minooka. Now they will be submitted to the lender to see if they will also accept.

Seller’s accepted contracts that are contingent on the buyer closing on their current home.  1 with a kick-out clause of 72 hours, 3 with 48 hours, and 1 with 24 hours.

Also, seller’s accepted contracts that are contingent on the buyer selling and closing on their current home.  3 with a kick-out clause of 72 hours, 2 with 48 hours, and 1 with 24 hours.

Median price of homes that went under contract this week $435,000 with 58 days average market time, last week $419,000 with 47 days average market time.

Under contract stats 110924
Under contract stats for week ending November 9th

2024 by the month

Month        New   Closed   Under contract

January          576        523               599

February        637        416                691

March            674         612               792

April              800         688               801

May              1077        1002             1075

June             1009         906               918

July              1173        1050             1094

August           883         858               725

September     849         734               777

October         990         936               878

November       191          143                163

Totals       8859    7868         8513

Check back with us every Saturday for the real estate market update for the Fox Valley area of Illinois.  At the end of each month we will also take a look back at 2023 and 2022.

Contact us

Call us at 630-503-6555 with all your real estate questions.  Your goal is our goal.

Check out some great resources that might be of help to you. Click on everything that is bold and underlined to take you to the information.

You can also request a home valuationsign-up for email alerts, and search for a home anytime.

All data provided today was downloaded from our MLS, MRED, LLC.

Fox Valley home prices November 9th.  Have an awesome week!

Kristine Heiman, Designated Managing Broker

SFR, SRS, SRES, AHWD

Best Homes Fox Valley

200 Webster St

Montgomery, IL 60538

630-503-6555 Ext 101
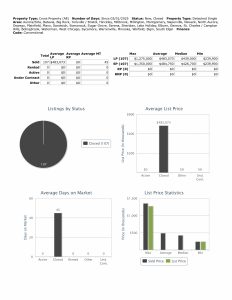
Fox Valley home prices November 2nd

Fox Valley home prices November 2nd

Fox Valley home prices November 2nd. 60 and sunny today.  This next week will be mid 50’s to upper 60’s.  I am enjoying this wonderful weather!

New listings this week are down.  151 this week compared to 175 the previous week.

Closed listings are up.  226 this week compared to 183 the previous week.

Here is the communities with the most activity this week in the Fox Valley area of Illinois.

Aurora-New 19 $139,900-$825,000

             Closed-32 $200,000-$960,000

Bolingbrook-New 6 $294,900-$539,000

                    Closed-15 $235,000-$900,008

Elgin-New 20 $219,500-$625,000

         Closed-25 $227,000-$604,006

Montgomery-New 0

                     Closed-12 $225,000-$405,000

Naperville-New 20 $379,900-$2,499,995

                 Closed-39 $449,000-$2,200,000

Oswego-New 11 $349,900-$560,900

              Closed-13 $260,000-$719,160

Plainfield-New 20 $324,900-$929,000

                Closed-15 $325,000-$922,277

St Charles-New 8 $424,000-$1,195,000

                  Closed-12 $265,000-$3,200,000

Yorkville-New 11 $325,000-$519,900

               Closed-8 $446,500-$665,000

Other communities had activity this week.  Look at the photo above for the price ranges.

Financing used, median prices, and 2,000 SF or more

Median list price this week $450,000, last week $444,995.

Closed median price this week $463,120, last week $435,000.

Stats 110224
Stats for week ending November 2nd

Conventional financing was used to close on 175 homes this week at median price $480,000 with 35 days average market time, last week 135 homes at median price $456,990 with 30 days average market time.

Conv 110224
Conventional financing used to close for week ending November 2nd

Cash was used to close on 30 homes this week at median price $590,000 with 18 days average market time, last week 27 homes at median price $369,900 with 20 days average market time.

Cash 110224
Cash used to close for week ending November 2nd

FHA financing was used to close on 16 homes this week at median price $300,500 with 25 days average market time, last week 14 homes at median price $362,500 with 53 days average market time. 

FHA 110224
FHA financing used to close for week ending November 2nd

VA financing was used to close on 5 homes this week at median price $473,990 with 37 days average market time, last week 6 homes at median price $410,000 with 23 days average market time.

VA 110224
VA financing used to close for week ending November 2nd

2,000 SF or more closed on 143 homes this week at median price $570,000 with 38 days average market time, last week 107 homes at median price $503,000 with 36 days average market time.  Minimum price this week $263,000, last week $193,000.

2000 SF or more 110224
2,000 SF or more closed for week ending November 2nd

A little over 63% of homes closed this week were at least 2,000 SF or more.  Conventional financing was used to close on a little over 77% of homes this week.  Cash was double FHA financing.

Under contract this week

Homes that went under contract this week were down.  155 this week compared to 181 the previous week.

Fox Valley home prices November 2nd-Under contract this week

Aurora-14                            Batavia-11

Bolingbrook-14                     Elgin-11

Naperville-13                       Oswego-10

Plainfield-18

No short sales were accepted by seller’s this week.

Seller’s accepted contracts that are contingent on the buyer closing on their current home.  3 with a kick-out clause of 72 hours, 5 with 48 hours, and 1 with 24 hours.

Also, seller’s accepted contracts that are contingent on the buyer selling and closing on their current home.  2 with a kick-out clause of 72 hours, 1 with 48 hours, and 1 with 24 hours.

Under contract median price this week $419,000 with 47 days average market time, last week $424,900 with 40 days average market time.

Under contract stats 110224
Under contract stats for week ending November 2nd

2024 by the month and a look back at 2023 and 2022

2024

Month       New   Closed   Under contract

January         576       523               599

February       637        416               691

March            674       612               792

April              800       688               801

May              1077      1002             1075

June             1009       906                918

July              1173      1050              1094

August           883       858                725

September     849       734                777

October         990       936                878

Totals       8668   7725         8350

2023

January          483       326                470

February        630       526                 789

March             555      558                 726

April               710       617                 755

May                735       603                 816 

June             1030      1059                 926

July                765       745                 805

August            869       988                 915

September      684       621                 623

October          639       568                 549

Totals       7100    6611         7374

2022

January           422       492                623

February         523       520                724

March              734      904                 890

April               1168       966               1334

May                 1101       893                 806

June               1295     1409                1234

July                 955       932                 908

August            1019      1134               1062

September       730      733                 698

October           699       612                 646

Totals        8646   8595         8925

We are doing better than last year, even with higher interest rates,  but worse than 2022.

Check back with us every Saturday for the real estate market update for the Fox Valley area of Illinois.

Contact us

Call us at 630-503-6555 with all your real estate questions.    Your goal is our goal.

Here is some information that might help you.  Click on everything that is bold and underlined to take you to the information.

You can also request a home valuationsign-up for email alerts, andsearch for a home anytime.

All data provided today is downloaded from our MLS, MRED, LLC.  It changes throughout the day.

Fox Valley home prices November 2nd.  Have an awesome week!

Kristine Heiman, Designated Managing Broker

SFR, SRS, SRES, AHWD

Best Homes Fox Valley

200 Webster St

Montgomery, IL 60538

630-503-6555 Ext 101

Fox Valley home prices October 26th

Fox Valley home prices October 26th

Fox Valley home prices October 26th.  It is a gorgeous fall day today.   Sunny and 60 for a high.  This next week it will range from 50-81.

New listings this week are down.  175 this week compared to 214 the previous week.

Closed listings are up.  183 this week compared to 150 the previous week.

Here are the communities with the most activity this week.

Aurora-New 15 $194,900-$738,000

            Closed-21 $212,500-$825,000

Bolingbrook-New 9 $255,000-$795,000

                    Closed-10 $250,000-$522,500

Elgin-New 15 $134,900-$760,000

         Closed-21 $151,000-$707,755

Geneva-New 3 $339,000-$699,900

             Closed-10 $330,000-$750,000

Naperville-New 22 $449,900-$1,495,000

                 Closed-30 $334,000-$1,251,000

Plainfield-New 22 $300,000-$859,000

                Closed-23 $277,500-$770,214

St Charles-New 13 $215,000-$875,000

                  Closed-16 $200,000- $1,150,000

Yorkville-New 10 $335,000-$649,000

               Closed-8 $399,900-$605,000

Other communities had activity this week.  Look at the photo above for their price ranges.

Financing used, median price, and 2,000 SF or more

Median list price this week $444,995, last week $439,250.

Closed median price this week $435,000, last week $420,250.

Stats 102624
Stats for week ending October 26th

Conventional financing was used to close on 135 homes this week at median price $456,990 with 30 days average market time, last week 109 homes at median price $447,700 with 44 days average market time.

Conv 102624
Conventional financing used to close for week ending October 26th

Cash was used to close on 27 homes this week at median price $369,900 with 20 days average market time, last week 18 homes at median price $415,000 with 23 days average market time.

Cash 102624
Cash used to close for week ending October 26th

FHA financing was used to close on 14 homes this week at median price $362,500 with 53 days average market time, last week 17 homes at median price $360,000 with 24 days average market time.

FHA 102624
FHA financing used to close for week ending October 26th

VA financing was used to close on 6 homes this week at median price $410,000 with 23 days average market time, last week 4 homes at median price $452,250 with 29 days average market time.

VA 102624
VA financing used to close for week ending October 26th

2,000 SF or more closed on 107 homes this week at median price $530,000 with 36 days average market time, last week 80 homes at median price $515,000 with 53 days average market time.  Minimum price this week $193,000, last week $300,000.

2000 SF or more 102624
2,000 SF or more closed for week ending October 26th

There were more cash deals closed this week than FHA.  Conventional continues to be the way to go if you are using financing to close.

Under contract this week

Homes that went under contract this week are consistent.  181 this week compared to 174 the previous week.

Fox Valley home prices October 26th-Under contract this week

Communities that seller’s accepted the most contracts this week.

Aurora-21                      Bolingbrook-20

Elgin-11                          Naperville-24

Oswego-11                      Plainfield-25

St Charles-12

1 short sale was accepted by a seller this week.  It was in Batavia.  Now it will be submitted to the lender to see if they will also accept.

Seller’s accepted contracts that are contingent on the buyer closing on their current home.  5 with a kick-out clause of 72 hours, 6 with 48 hours, and 1 with 24 hours.

Also, seller’s accepted contracts that are contingent on the buyer selling and closing on their current home.  1 with a kick-out clause of 72 hours, and 3 with 48 hours.

Under contract median price this week $424,900 sigh 40 days average market time, last week $442,450 with 47 days average market time.

Under contract stats 102624
Under contract stats for week ending October 26th

2024 by the month

Month            New   Closed   Under contract

January           576      523           599

February         637      416            691

March              674      612           792

April                800      688           801

May                1077     1002         1075

June                1009      906           918

July                  1173     1050         1094

August              883      858           725

September        849      734            777

October             839      710            723

Totals               8517    7499          8195

Check back with us every Saturday for the real estate market update for the Fox Valley area of Illinois.  At the end of each month we will also take a look back at 2023 and 2022 so you have something to compare to.

Next week there is 4 days left of October so we will do the end of the month look back then.

Contact us

Call us at 630-503-6555 with all your real estate questions.  Your goal is our goal.

Here are some links to information that you might want to take a look at.  Click on everything that is bold and underlined to take you to the information.

You can also request a home valuationsign-up for email alerts, and search for a home anytime.

All data provided today was downloaded from our MLS, MRED, LLC.  It changes throughout the day.

Fox Valley home prices October 26th.  Have an awesome week!

Kristine Heiman, Designated Managing Broker

SFR, SRS, SRES, AHWD

Best Homes Fox Valley

200 Webster St

Montgomery, IL 60538

630-503-6555 Ext 101
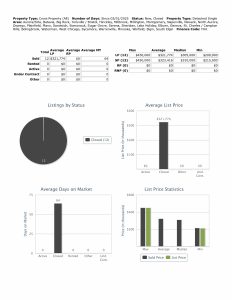
Fox Valley home prices October 19th

Fox Valley home prices October 19th

Fox Valley home prices October 19th.  It is going to be a gorgeous weekend with temperatures in the mid 70’s to lower 80’s.  The week ahead should be in the mid 60’s to lower 70’s.

New listings are consistent.  214 this week compared to 219 the previous week.

Closed listings are slightly down.  150 this week compared to 168 the previous week.

Here are the communities with the most activity this week and their price ranges.

Aurora-New 23 $149,900-$849,000

             Closed-18 $160,000-$550,000

Bolingbrook-New 14 $264,900-$715,000

                      Closed-10 $255,000-$540,000

Elgin-New 24 $175,000-$674,900

          Closed-19 $205,000-$1,395,000

Naperville-New 33 $340,000-$1,795,000

                   Closed-22 $365,000-$2,360,000

North Aurora-New 12 $299,999-$730,000

                        Closed-2 $428,000-$603,476

Plainfield-New 20 $194,900-$747,000

                  Closed-13 $339,900-$616,226

St Charles-New 15 $299,900-$899,900

                  Closed-11 $250,000-$990,000

Look at the photo above for other communities that also had activity this week and their price ranges.

Financing most used, median prices, and 2,000 SF or more

Median list price this week $439,250, last week $460,000.

Closed median price $420,250, last week $431,500.

Stats 101924
Stats for week ending October 19th

Conventional financing was used to close on 109 homes this week at median price $447,700 with 44 days average market time, last week 125 homes at median price $450,000 with 30 days average market time.

Conv 101924
Conventional financing used to close for week ending October 19th

Cash was used to close on 18 homes this week at median price $415,000 with 23 days average market time, last week 22 homes at median price $407,500 with 29 days average market time.

Cash 101924
Cash used to close for week ending October 19th

FHA financing was used to close on 17 homes this week at median price $360,000 with 24 days average market time, last week 13 homes at median price $329,999 with 30 days average market time.

FHA 101924
FHA financing used to close for week ending October 19th

VA financing was used to close on 4 homes this week at median price $452,250 with 29 days average market time, last week 6 homes at median price $312,500 with 22 days average market time. 

VA 101924
VA financing used to close for week ending October 19th

2,000 SF or more closed on 80 homes this week at median price $515,000 with 53 days average market time, last week 101 homes at median price $525,000 with 35 days average market time.  Minimum price this week $300,000, last week $230,000.

2000 SF or more 101924
2,000 SF or more closed for week ending October 19th

We continue on the trend that most homes are closed using conventional financing in our area.

Under contract this week

Homes that went under contract were down.  174 this week compared to 191 the previous week.

Fox Valley home prices October 19th-Under contract this week

Communities that seller’s accepted the most contracts this week.

Aurora-18                        Elgin-18

Naperville-21                  Oswego-15

Plainfield-28                   St Charles-13

Click on the photo to see other communities that seller’s accepted contracts this week.

2 short sales were accepted by seller’s this week.  1 was in Plainfield and 1 was in Sugar Grove.  Now they will be submitted to the lender to see if they will also accept.

Seller’s accepted contracts that are contingent on the buyer closing on their current home.  2 with a kick-out clause of 72 hours, 2 with 48 hours, and 1 with 24 hours.

Also, seller’s accepted contracts that are contingent on the buyer selling and closing on their current home.  2 with a kick-out clause of 72 hours, 2 with 48 hours, and 1 with 24 hours.

Under contract media price this week $442,450 with 47 days average market time, last week $420,321 with 43 days average market time.

Under contract stats 101924
Under contract stats for week ending October 19th

2024 by the month

Month              New   Closed   Under contract

January             576       523            599

February           637       416             691

March                674       612             792

April                  800      688            801

May                  1077     1002          1075

June                  1009      906            918

July                    1173    1050          1094

August               883      858            725

September         849      734             777

October              664       527            542

Totals               8342     7316          8014

Check back with us every Saturday for the real estate market update for the Fox Valley area of Illinois.

At the end of each month we will also take a look back at 2023 and 2022 so you have something to compare to.

Contact us

Call us at 630-503-6555 with all your real estate questions.  Your goal is our goal.

Take a look at some resources that might interest you.  Click on everything that is bold and underlined to take you to the information.

You might also want torequest a home valuationsign-up for email alerts, and search for a home anytime.

All data provided today is from our MLS, MRED, LLC.  It changes throughout the day.

Fox Valley home prices October 19th.  Have an awesome week!

Kristine Heiman, Designated Managing Broker

SFR, SRS, SRES, AHWD

Best Homes Fox Valley

200 Webster St

Montgomery, IL 60538

630-503-6555 Ext 101
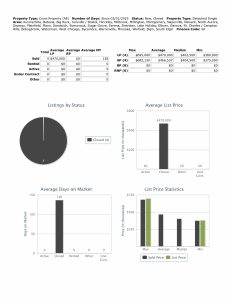
Fox Valley home prices October 12th

Fox Valley home prices October 12th

Fox Valley home prices October 12th.  Today is the last day in the 70’s for a while.  It will be in the 60’s this next week.

New listings this week are down slightly.  219 this week compared to 231 the previous week.

Closed listings are down.  168 this week compared to 209 the previous week.

Aurora-New 16 $139,900-$719,000

             Closed-26 $169,000-$555,000

Batavia-New 12 $475,000-$719,907

               Closed-2 $235,000-$324,000

Bolingbrook-New 14 $340,000-$1,395,000

                      Closed-4 $201,000-$341,000

Elgin-New 18 $195,000-$750,000

          Closed-12 $124,000-$690,000

Naperville-New 28 $350,000-$1,599,000

                   Closed-25 $425,000-$1,750,000

Oswego-New 11 $295,000-$669,000

               Closed-10 $261,000-$680,000

Plainfield-New 52 $245,000-$899,000

                  Closed-26 $275,000-$678,983

St Charles-New 13 $259,000-$1,350,000

                   Closed-12 $270,000-$785,000

Take a look at Plainfield!

These are the communities with the most activity this week.  Other communities had activity as well.  Take a look at their price ranges in the photo above.

Financing most used, median price ranges, and 2,000 SF or more

Median list price this week $460,000, last week $450,000.

 Closed median price this week $431,500, last week $430,000.

Stats 101224
Stats for week ending October 12th

Conventional financing was used to close on 125 homes this week at median price $450,000 with 30 days average market time, last week 155 homes at median price $449,000 with 28 days average market time.

Conv 101224
Conventional financing used to close for week ending October 12th

Cash was used to close on 22 homes this week at median price $407,500 with 29 days average market time, last week 33 homes at median price $390,000 with 54 days average market time.

Cash 101224
Cash used to close for week ending October 12th

FHA financing was used to close on 13 homes this week at median price $329,999 with 30 days average market time, last week 14 homes at median price 325,000 with 24 days average market time.

FHA 101224
FHA financing used to close for week ending October 12th

VA financing was used to close on 6 homes this week at median price $312,500 with 22 days average market time, last week 6 homes at median price $497,500 with 14 days average market time.

VA 101224
VA financing used to close for week ending October 12th

2,000 SF or more closed on 101 homes this week at median price $525,000 with 35 days average market time, last week 128 homes at median price $520,000 with 39 days average market time.  Minimum price this week $230,000, last week $253,000.

2000 SF or more 101224
2,000 SF or more closed for week ending October 12th

Under contract this week

Homes that went under contract this week are up.  191 this week compared to 177 the previous week.

Fox Valley home prices October 12th-Under contract this week

Aurora-29                             Bolingbrook-10

Elgin-15                                 Naperville-22

Plainfield-33                          St Charles-16

Yorkville-12

No short sales were accepted by seller’s this week.

Seller’s accepted contracts that are contingent on the buyer closing on their current homes.  5 with a kick-out clause of 72 hours, 5 with 48 hours, and 1 with 24 hours.

Also, seller’s accepted contracts that are contingent on the buyer selling and closing on their current home.  1 with a kick-out clause of 72 hours, 6 with 48 hours, and 2 with 24 hours.

Median price of homes that went under contract this week $420,321 with 43 days average market time, last week $440,000 with 44 days average market time.

Under contract stats 101224
Under contract stats for week ending October 12th

2024 by the month

Month            New   Closed   Under contract

January           576       523         599

February         637       416          691

March              674       612          792

April                800       688         801
May                1077      1002       1075

June                1009       906         918

July                  1173      1050       1094

August              883       858         725

September        849       734          777

October             450       377          368

Totals               8128     7166        7840

Check back with us every Saturday for the real estate market update for the Fox Valley area of Illinois.

At the end of each month we will also take a look back at 2023 and 2022 so you have something to compare to.

Contact us

Call us at 630-503-6555 with all your real estate questions.  Your goal is our goal.

Every week we post these resources for you to check out.  Click on everything that is bold and underlined to take you to the information.

Here is information on my website for you to check out.  Request home valuationSign-up for email alerts, and search for a home anytime.

All data provided today was downloaded from our MLS, MRED, LLC.  It changes throughout the day as agents upload information.

Fox Valley home prices October 12th.  Have an awesome week!

Kristine Heiman, Designated Managing Broker

SFR, SRS, SRES, AHWD

Best Homes Fox Valley

200 Webster St

Montgomery, IL 60538

630-503-6555 Ext 101